Jobs
5 Things Dividend Investors Need To Know About The Fed, Jobs, And Inflation

alfexe
It’s been an interesting few weeks of economic news. So, to help you make sense of the wild swings in stocks and bonds, let’s take a look at the five things investors need to know about jobs, inflation, and the Fed’s plans for interest rates.
1. What You Need To Know About Jobs
The latest jobs report, released on Friday, June 7, provides a comprehensive overview of the U.S. labor market’s performance in May 2024 and showed a stronger-than-expected jobs market.
Total Jobs Added: The U.S. economy added 272,000 net jobs in May, far exceeding the 180,000 jobs expected.
Sector Performance
Healthcare: 68,000 jobs. Government: 43,000 jobs. Leisure and Hospitality: 42,000 jobs. Professional, Scientific, and Technical Services: 32,000 jobs. Manufacturing and Services: 8,000 and 204,000 jobs, respectively
Unemployment Rate
Increased to 4.0% from 3.9% in April.
Number of Unemployed: 6.6 million people, a slight rise from April.
This ends the impressive 27-month streak of sub-4 % unemployment.
For context, in the entire 1970s, 1980s, and 1990s, we never achieved a 4% unemployment rate.
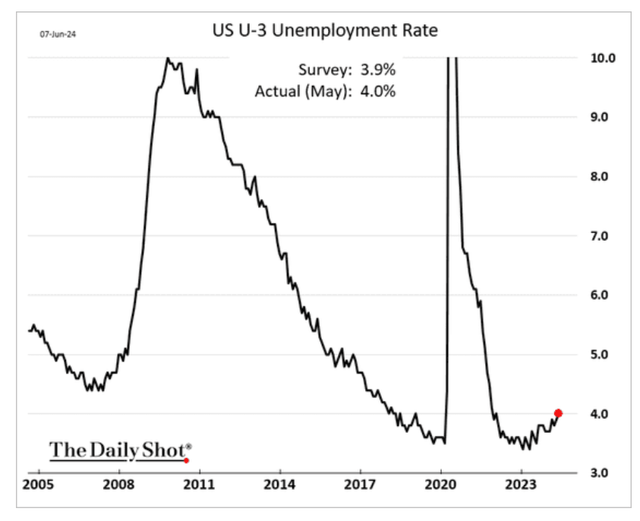
Daily Shot
The Fed expects unemployment to stabilize at 4.2%. For context, the average unemployment rate of the last 50 years is 5.75%.
Job Openings and Labor Turnover
Job Openings: 8.1 million in April, down from 8.4 million in March.
Quit Rate: Steady at 2.2%.
Weekly Jobless Claims Initial Claims: Rose by 8,000 to 221,000 for the week ending June 1 and hit 245K on Thursday, June 13.
Moody’s considers 270K per week “consistent with a healthy economy.”
Wage Growth
Average Hourly Earnings**: Up by 0.4% in May, with a year-over-year increase of 4.1%.
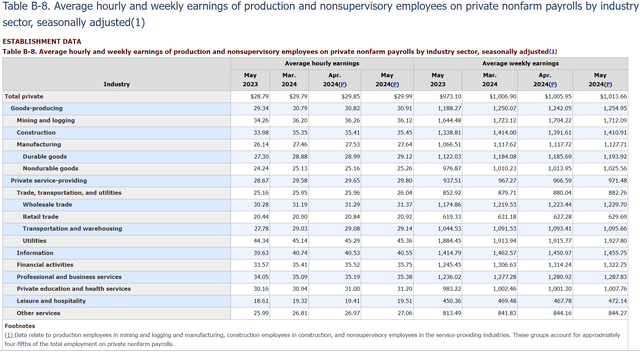
BLS
The more critical wage is the growth rate of non-supervisory workers, which is 80% of Americans.
The 4.2% YoY wage growth for non-supervisors is solid, and weekly earnings (accounting for hours worked) are also up 4.2% as hours worked held steady.
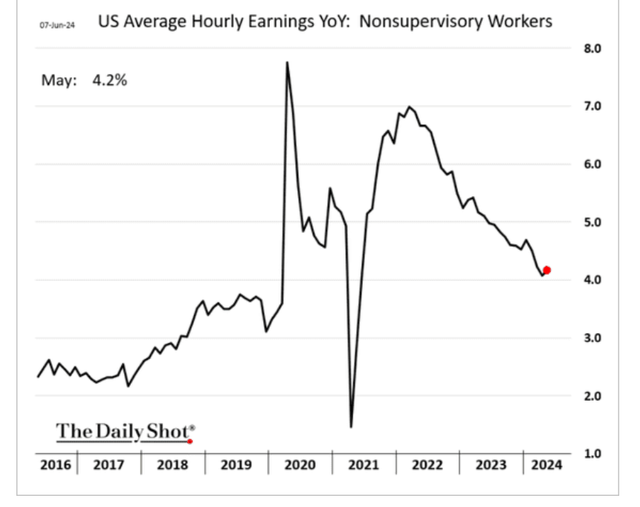
Daily Shot
Wage growth has slowed from its torrid pace, though it may be stabilizing.
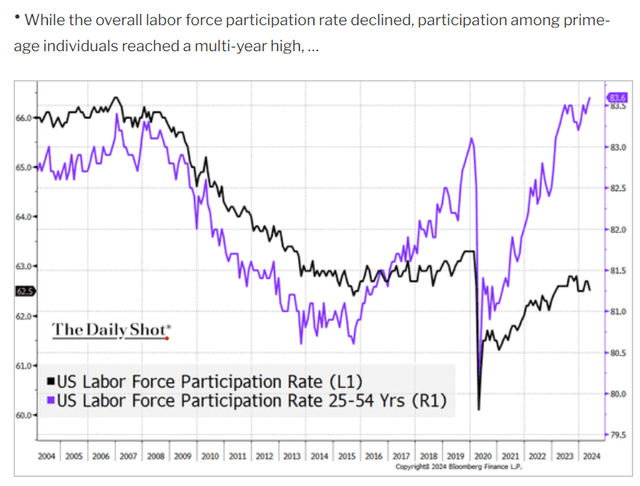
Daily Shot
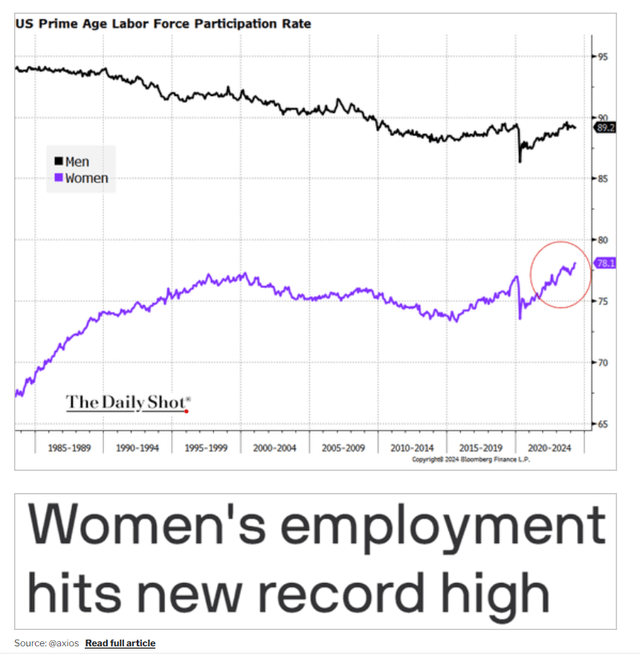
The labor market has fully recovered from the pandemic and continues to drive strong wage growth for Main Street.
Daily Shot
And that includes women re-entering the workforce.
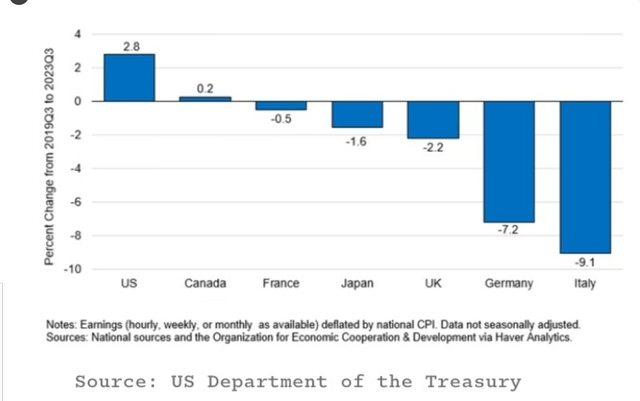
Inflation-Adjusted Wage Growth: America Is The Envy Of The Developed World
Ritholtz
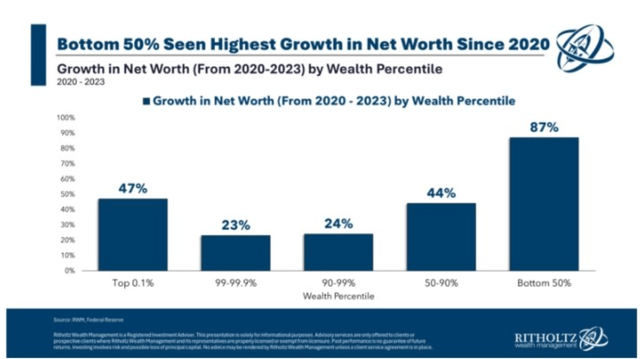
And it’s not just income; it’s also net worth.
Ritholtz
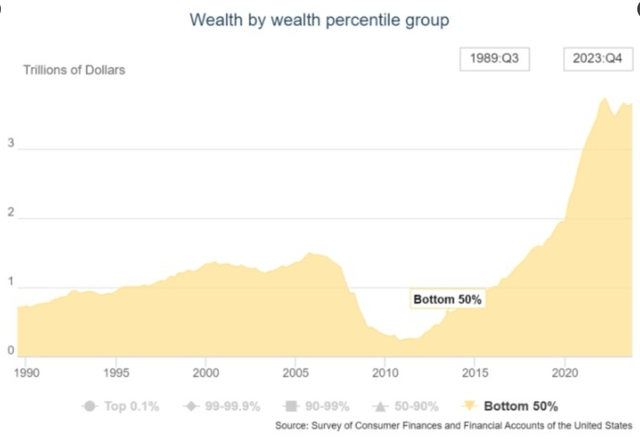
I want to show you just how impressive this is…
Ritholtz
$1.5 trillion in new net worth creation for the bottom 50% of Americans since 2018, just six years.
That equals all the net worth generated in US history in six years.
Amazon doubled its delivery capacity in two years, which is even more impressive.
Ritholtz
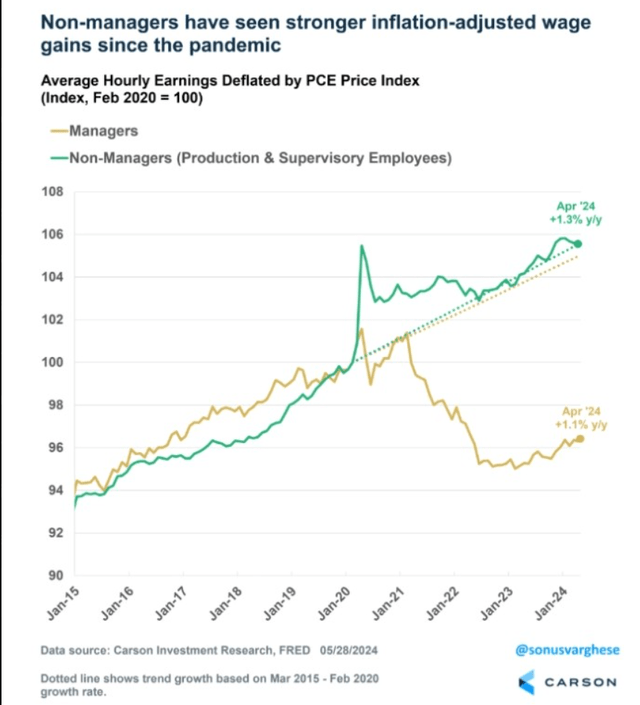
For the first time in 42 years, regular workers have been doing better than management.
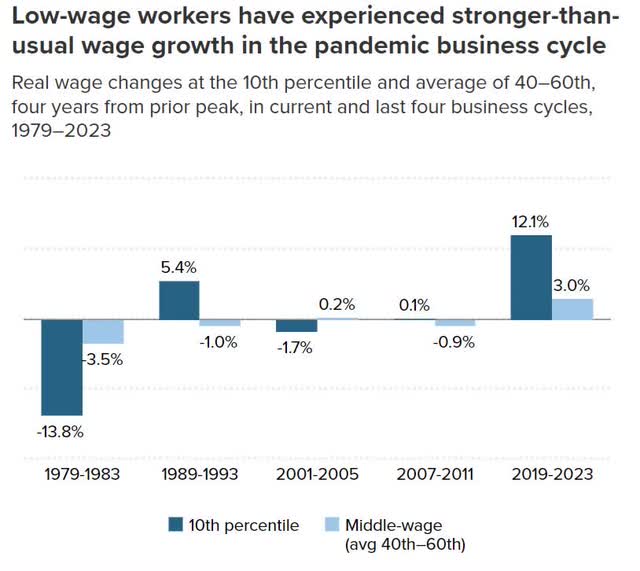
EPI
Unlike the 1970s, the middle class and poor have actually done better than other groups, especially the highest-income Americans.
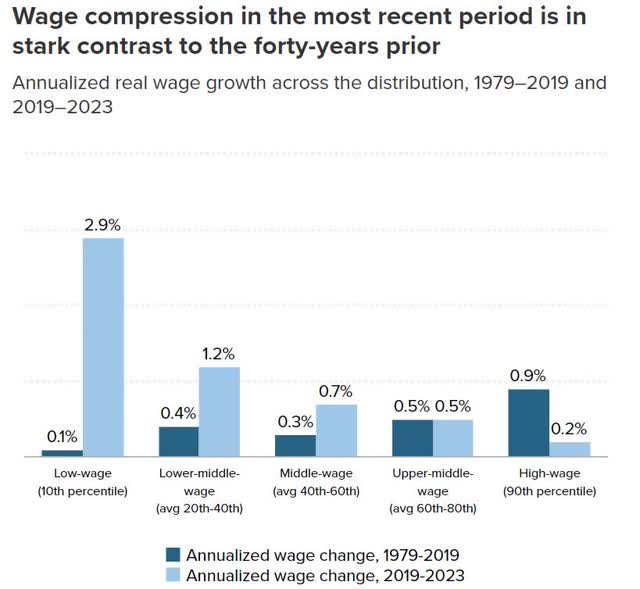
EPI
By the end of 2023, every income percentile achieved positive inflation-adjusted wage growth. And we’ve been running ahead of inflation by about 0.5% per month in 2024.
The Economic Recovery Has Been Very Broad, Benefiting Even The Most Vulnerable Americans
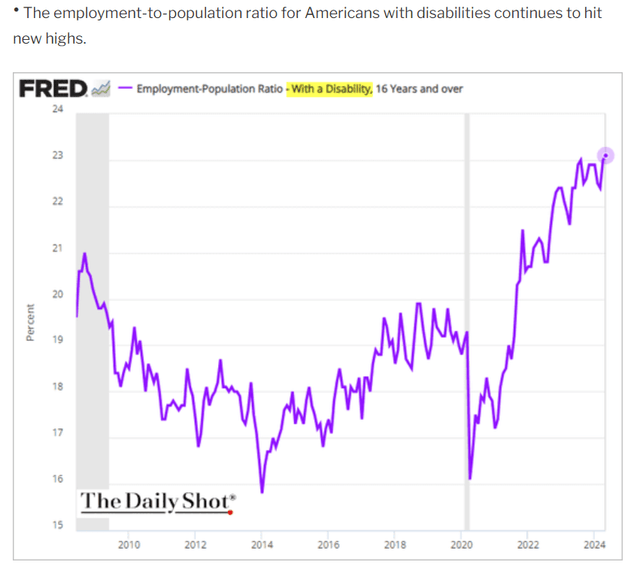
Ritholtz
In other words, the economy isn’t just vital for the rich. In the post-pandemic era, the middle class and poorer Americans have been experiencing the best gains in decades.
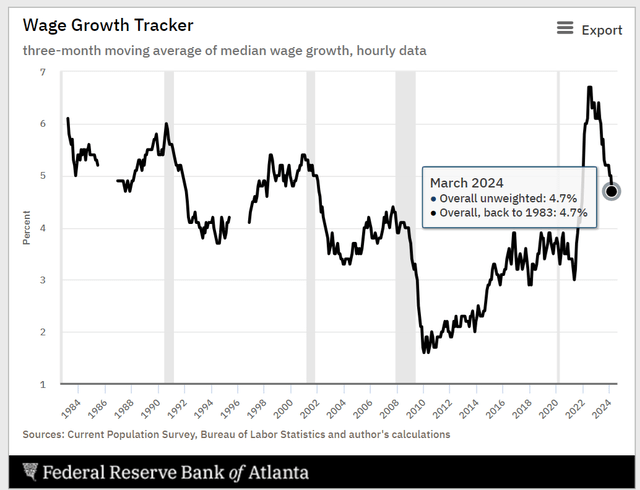
Atlanta Fed
The Fed’s wage growth tracker shows wages growing at 4.7%, which is great news for Main Street.
The Atlanta Fed surveys 60,000 households monthly and asks how wages have changed over the past year.
This cohort study tracks individual wages and is considered one of the most accurate ways to measure real wage growth for Americans.
4.7% wage growth is down from the highest levels ever recorded, but is still 1.4% above the inflation rate.
2. What You Need To Know About Inflation
Americans are now getting $3.7 trillion annually in dividends and interest income.
And combined with a strong job market, that explains why inflation has proven to be stubbornly resilient.
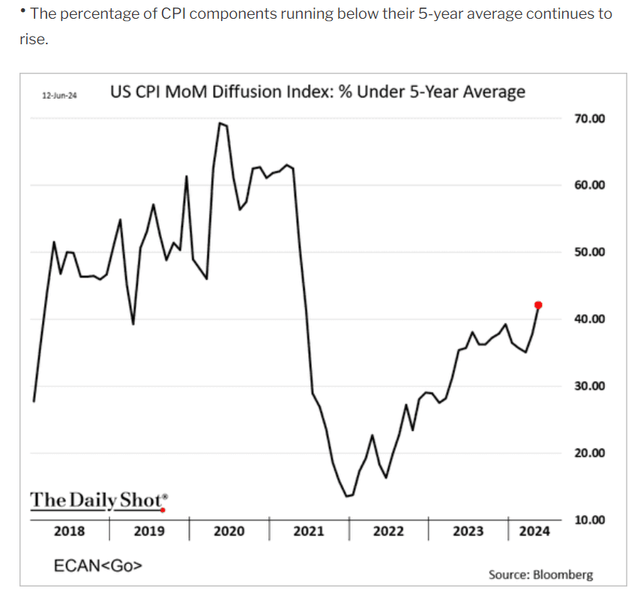
But now, it, too, is starting to show signs of cooling.
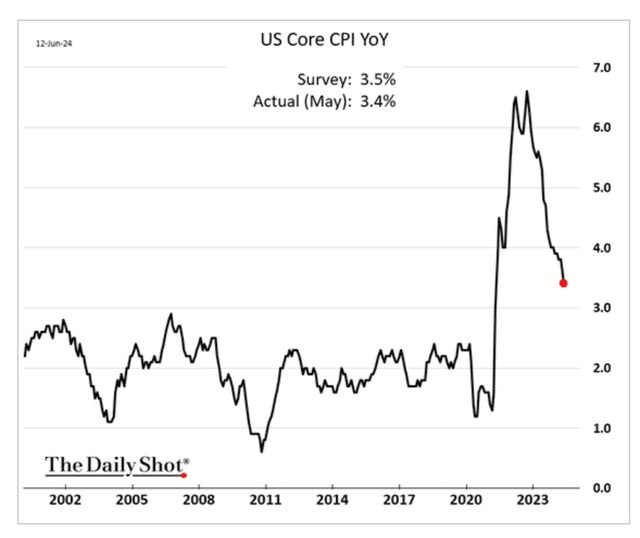
Daily Shot
Other inflation metrics also point to cooling inflation.
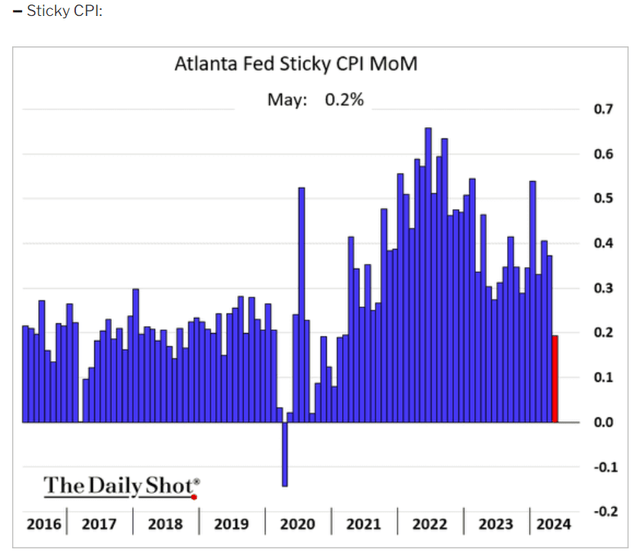
Daily Shot
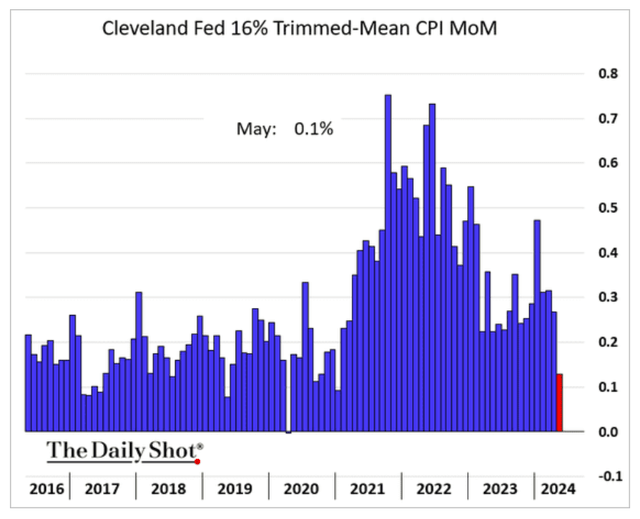
Daily Shot
Daily Shot
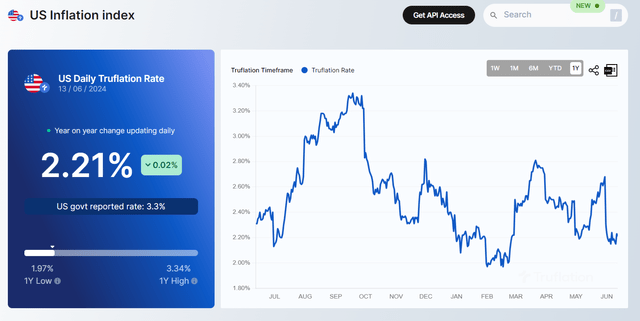
Truflation
The current truflation reading correlates 97% with a long-term 1.8% core PCE inflation rate, below the Fed’s 2% target.
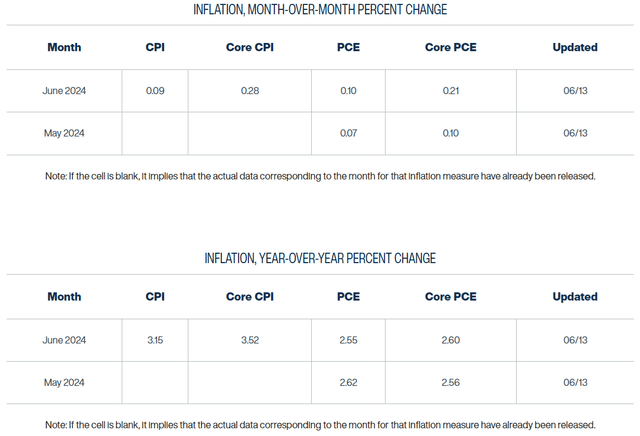
Cleveland Inflation-Now Cast
Cleveland Fed
The Cleveland Fed expects next month’s inflation report to show a CPI of 3.2% (down from 3.3%).
The core PCE rate is expected to end this month at 2.6% and next month.
0.21% monthly core PCE inflation annualized to 2.5% per year.
So, what does this mean for interest rates?
3. What You Need To Know About The Fed’s Plans For Interest Rates
FOMC
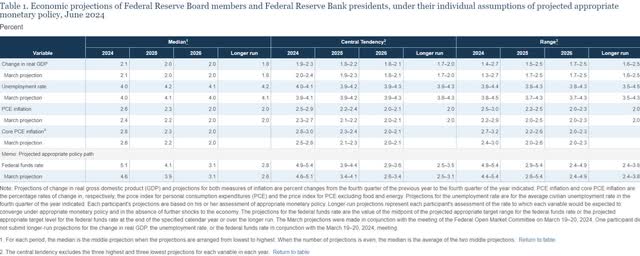
The Fed has updated its statement of economic projections or SOP. The famous dot plot shows just one cut this year and four next.
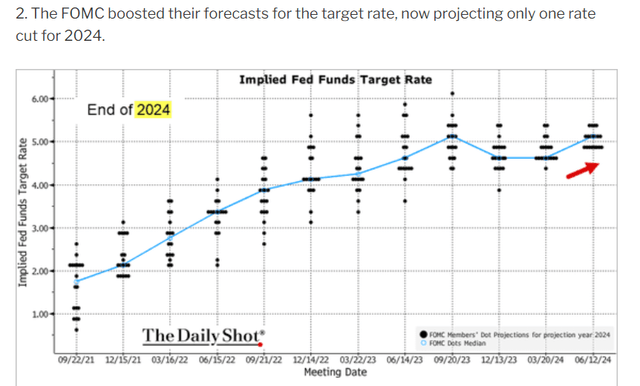
Daily Shot
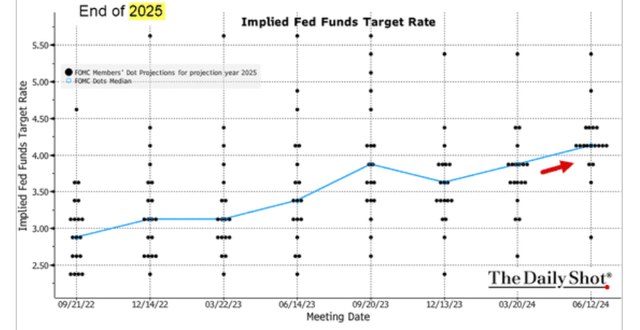
According to the Fed and the bond market, 2025 is now the year of the rate cut.
Daily Shot
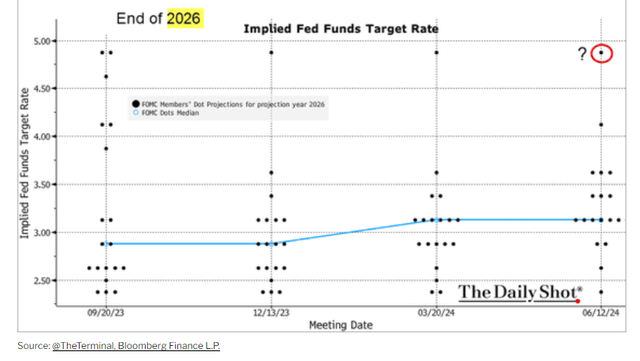
The Fed median consensus currently projects one cut this year, four cuts next year, four cuts in 2026, and then one final cut in 2027.
Daily Shot
In the press conference, Jerome Powell said that the Dot plot is not a plan, just a current forecast. If the facts change (and they will), the Fed will do something else.
This forecast is basically, “If everything we expect happens, we’ll cut to 2.75% by 2027.”
CME Group
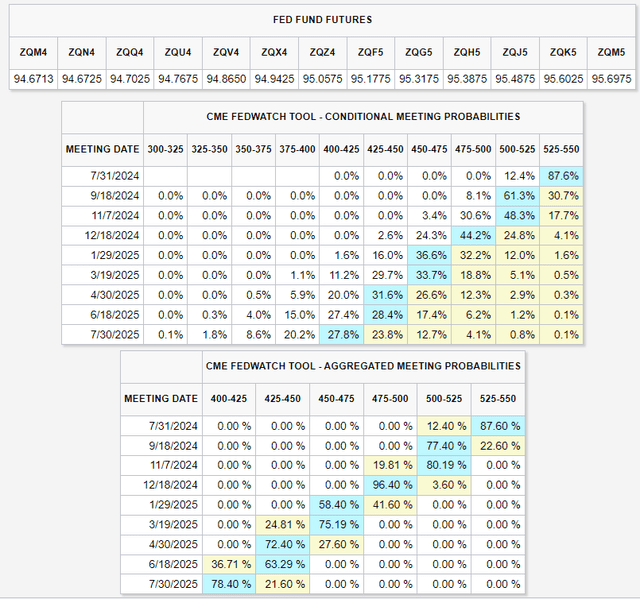
The bond market is now pricing a nearly 78% chance of four rate cuts over the next year.
MarketWatch
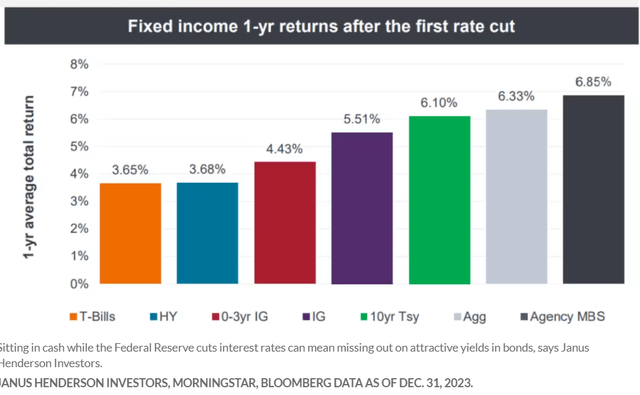
Bond investors historically enjoy a 6% gain in the first year after the first rate cut.
For long bond investors, a duration of 26 instead of the 10-year Treasury 6.7 means approximately a 25% rally in the first year.
However, the current blue-chip economist consensus is for the 30-year yield to fall from 4.5% today to 4% and rebound to 4.5% long term.
The consensus of blue-chip economists believes 10-year yields will average 4% long-term, and the bond market expects 4% Fed funds rates over time.
Note that a yield curve this flat will make recession forecasting more challenging.
4. What Does This Mean for the Economy?
The economy appears to be cooling, but cooling doesn’t mean cold or in danger of a recession.
Atlanta Fed
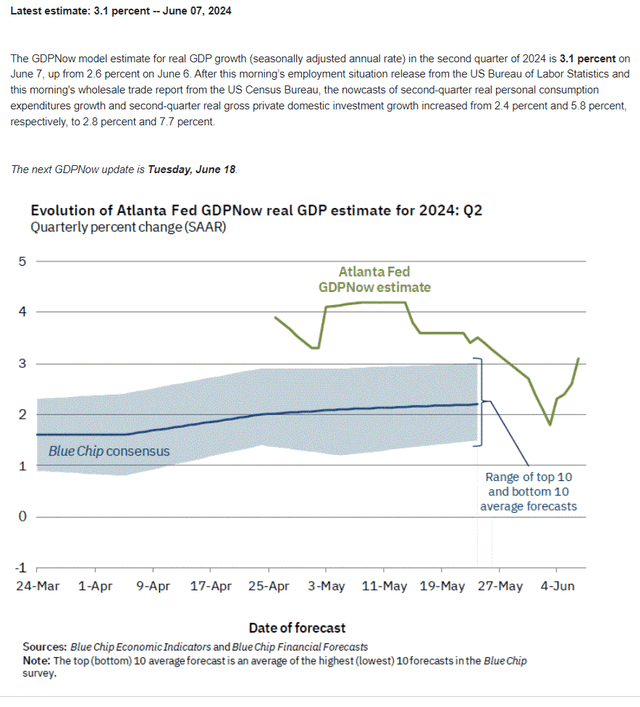
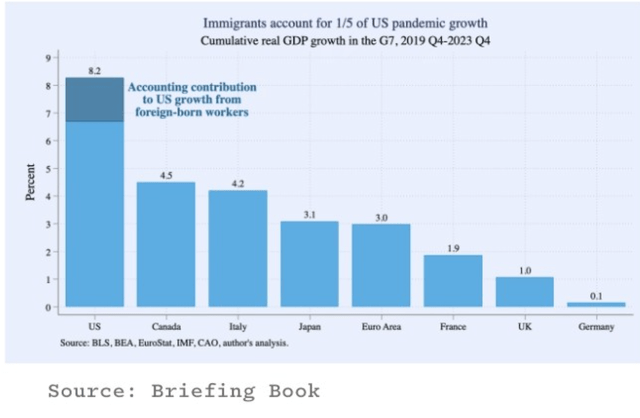
The Atlanta Fed thinks the economy is growing at 3.1%, powered partially by higher immigration, creating more workers, jobs, and spending.
Ritholtz
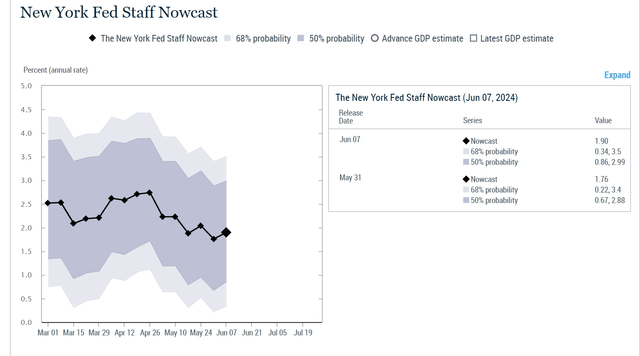
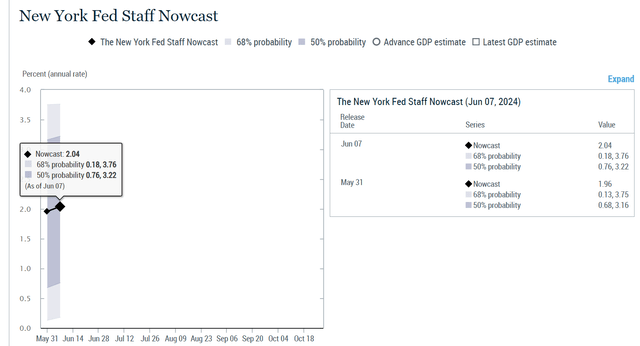
The New York Fed is less optimistic but still relatively bullish on the US economy.
New York Fed
The New York Fed’s Q2 growth model is steady, and its first Q3 estimates are now available.
New York Fed
The New York Fed is forecasting a “no landing” scenario in which the US economy doesn’t slow and has grown steadily at a similar rate since 2022.
5. What Does This Likely Mean For Stocks?
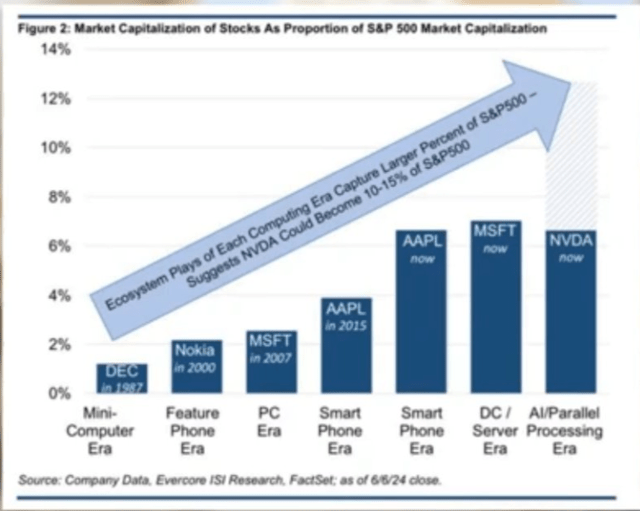
Evercore ISI is now saying NVIDIA (NVDA) might one day become as much as 15% of the S&P (which has a $6.8 trillion market cap today, though one imagines the S&P would be worth a lot more by the time this happens).
Ritholtz
Beth Kindig is a prominent technology analyst, CEO, and lead tech analyst for the I/O Fund. She also has a bullish thesis on NVDA that estimates sales up to $800 billion by 2030.
Assuming analysts are correct that FCF margins will remain steady at 47% to 49% (the current consensus), that would translate to a best-case scenario of $400 billion in free cash flow in 2030.
Apply the company’s historical median 45X FCF multiple to that and get an $18 trillion potential market cap for Nvidia by the end of 2029.
With all these extensive forecasts and companies like Nvidia delivering unprecedented gains ($1 trillion market cap in five weeks), it’s easy to believe that big tech is in a bubble.
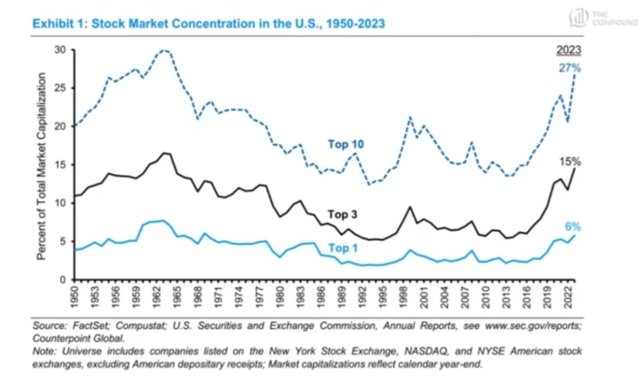
Proof That We’re In A Dangerous Bubble:
Ritholtz
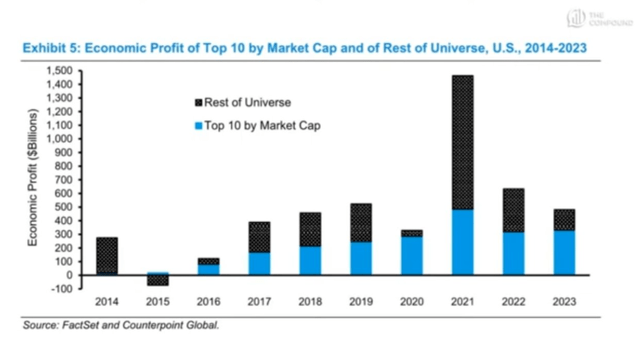
Except… 66% of economic profits come from the top 10 companies.
Ritholtz
Economic Profit=Total Revenue−(Explicit Costs+Implicit Costs)
Imagine you own a small bakery:
- Total Revenue: $100,000 from selling baked goods.
- Explicit Costs: $60,000 for ingredients, wages, and rent.
- Implicit Costs: $20,000, the salary you could have earned if you worked elsewhere.
27% of market cap and 66% of profits… so those gains are 100% justified by fundamentals.
Ritholtz
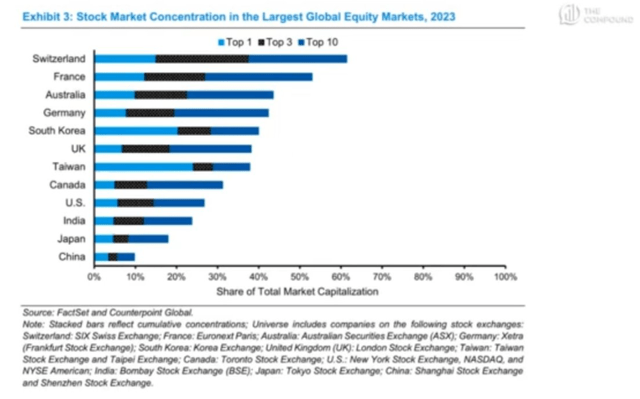
In other countries, stock markets are far more concentrated. Samsung accounts for 20% of South Korea’s market, and Taiwan Semi (TSM) accounts for 30% of Taiwan’s market cap. In Switzerland, where the top 10 companies comprise 66% of the market, 25% of the country’s market is Nestle (OTCPK:NSRGY).
S&P Valuation: Potentially Not Even Overvalued
| Week | 24 | |
| % Of Year Done | 2024 Weighting | 2025 Weighting |
| 46.15% | 53.85% | 46.15% |
| Forward S&P EV/EBITDA (Cash-Adjusted Earnings) | 10-Year Average | Market Overvaluation |
| 14.24 | 13.50 | 5.48% |
| S&P Fair Value | Decline To Fair Value | Fair Value PE |
| $5,151.65 | 5.19% | 19.51 |
(Source: Dividend Kings S&P Valuation Tool)
The S&P is only 5.5% overvalued if you compare EV/EBITDA to its 10-year average.
And what if you consider the Morningstar and FactSet growth forecasts of 11.7%? That’s nearly 2X the historical growth rate of corporate earnings.
| Potential Overvaluation (10-Year Average) | S&P 10-Year Average Cash-Adjusted PEG | S&P Current Cash-Adjusted PEG |
| -31.36% | 1.77 | 1.21 |
| Potential Overvaluation (25-Year Average) | S&P 20-Year Average |
S&P Current Cash-Adjusted PEG |
| -49.80% | 2.42 | 1.21 |
(Source: Dividend Kings S&P Valuation Tool)
Do I think the S&P is 50% undervalued? Not really. However, stocks are not in a bubble unless S&P earnings miss next year’s estimates by a wide margin.
This is why the US is the envy of global investors.
YCharts
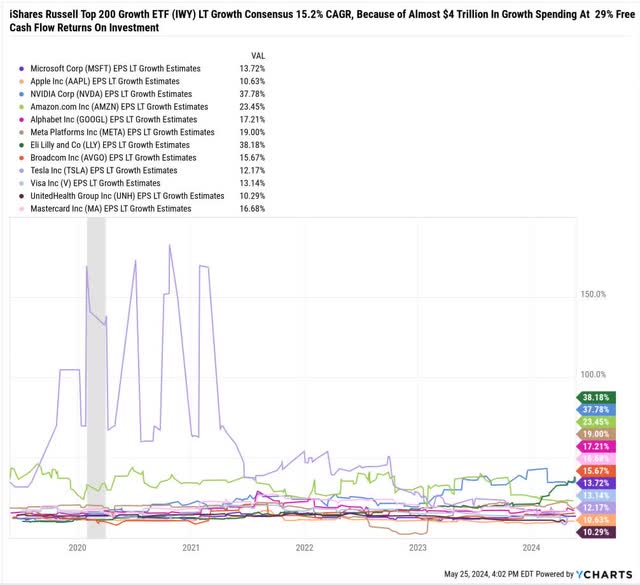
How can the 12 largest US growth companies grow earnings at 15% long term?
$3.5 Trillion in Growth Spending At 28% FCF Returns On Invested Capital = Tripling of Free Cash Flow From $522 trillion to over $1.5 trillion by 2030.

FactSet Research Terminal
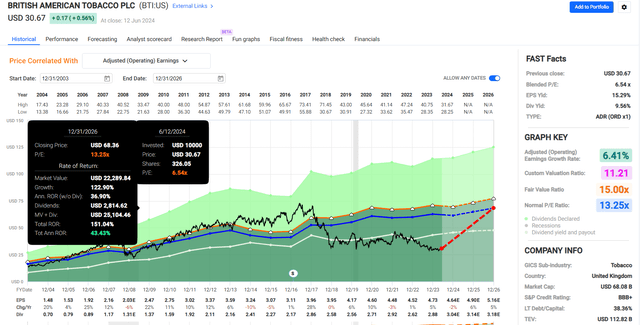
Does that mean everyone should be buying the Nasdaq? Or IWY? Or Nvidia? Of course not. If you can’t sleep at night owning these companies, do whatever it takes to invest in excellent value companies like British American (BTI) and its very low-risk yield of nearly 10%.
Nvidia’s consensus upside potential through the end of 2027: 90%. BTI, 140% through the end of 2026. And you get paid almost 10% to wait to see if they’re right.
FAST Graphs, FactSet
What if you’re worried about a market correction?
Remember, the market is 5.5% historically overvalued when considering cash on the balance sheet.
“I don’t care! I can’t tolerate a 10% or 15% correction; emotionally, I can’t handle it!”
OK, so diversify and consider a portfolio like this.
Since January 2021

Portfolio Visualizer
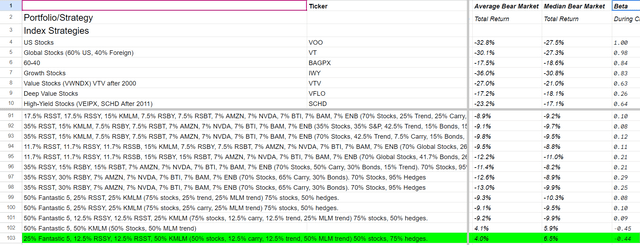
Six non-correlated asset classes combined to create Nasdaq-crushing returns with half the volatility and one-third the peak decline over the last 3.5 years.
And guess what? That 11.4% peak decline? That was the largest bear market for this portfolio of the last seven bear markets.
It was during the pandemic, not the 2022 bear market or the Great Recession.
Dividend Kings Portfolio Optimizer Tool
Tech Crash: + 24.4%
Great Recession: + 6.5%
2022 Bear Market: +13.8%
OK, but maybe you don’t trust Nvidia or Amazon and don’t like my personal Fantastic Five.
Since January 2021: 40% Stocks, 140% Hedges With Five ETFs and Zero Stock Picking

Portfolio Visualizer
Nasdaq-beating returns with less volatility than a 60-40 and a peak decline half as bad as the S&P, never mind the Nasdaq’s 33% drop.
Like Riding Over The Market’s Worst Potholes On A Hovercraft.
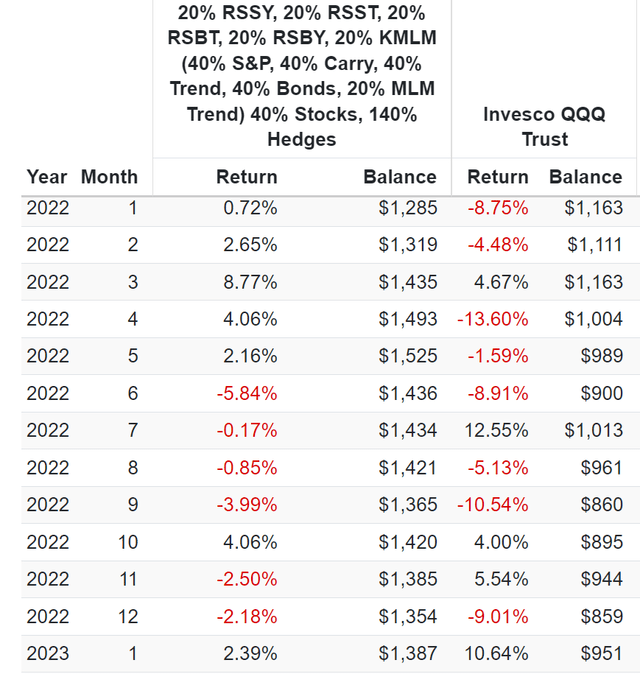
Portfolio Visualizer
Bottom Line: The Economy is Slowing, But Only Speculators Should Be Worried
Market timing isn’t the answer to corrections; prudent financial science is.
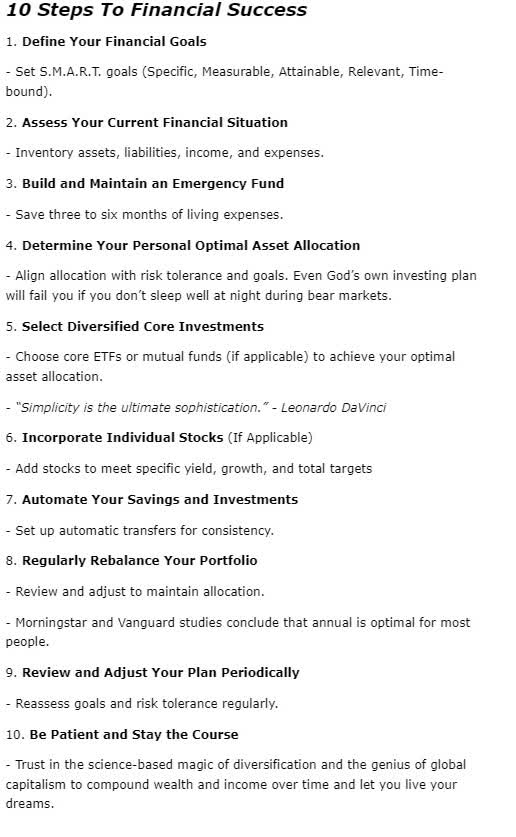
DK S&P Valuation Tool
If you focus on the fundamentals and ignore the hyperbolic ravings of attention-seeking talking heads on TV.
I’m a big proponent of evidence-based investing. And yes, I’m bullish on the future of the US economy and big tech.
But I’m also a passionate “tri-polar” income investor, with almost 20% of my portfolio invested in the best high-yield value blue chips.
Do you know the secret to truly sleeping well at night? In all market conditions? In a world where the only certainty is uncertainty? Owning the world’s best companies, directly or through index funds, alongside the right diversifying assets for our personal needs.
If you build the right bunker retirement portfolio, you never have to worry about the economy.
Or luck because you make your own luck over the long term.


