Jobs
Full-Time Jobs Fall Yet Again As Total Employment Flattens

Userba011d64_201
By Ryan McMaken
According to the most recent report from the federal government’s Bureau of Labor Statistics, the US economy added 206,000 jobs during June, while the unemployment rate rose slightly to 4.1 percent. Unlike most months over the past year—which repeatedly described the employment situation as “strong” and “a blowout”—the general media narrative for the June jobs report was far less enthusiastic. According to CNN, for example, the June jobs report suggests a ‘steady-as-she-goes’ US labor market.
Yet, the employment situation has not fundamentally changed from what has been common over the past year. That is, claims of solid, or even “blowout,” gains in employment have been unconvincing if we look at the bigger picture.
As we have seen repeatedly over the past year, reporting on monthly jobs reports have focused on a single data point within the report: the establishment survey’s total jobs number. Most reporting on June’s jobs numbers, for example, has ignored the fact that, according to the federal government’s household survey, the number of employed people in America has barely increased over the past year. Moreover, most of the “jobs” added by the establishment survey are due to made-up numbers created through the so-called “birth-death model” which simply assumes into existence hundreds of thousands of jobs created by hypothetical new businesses.
Let’s take a closer look.
Establishment Survey vs. Household Survey
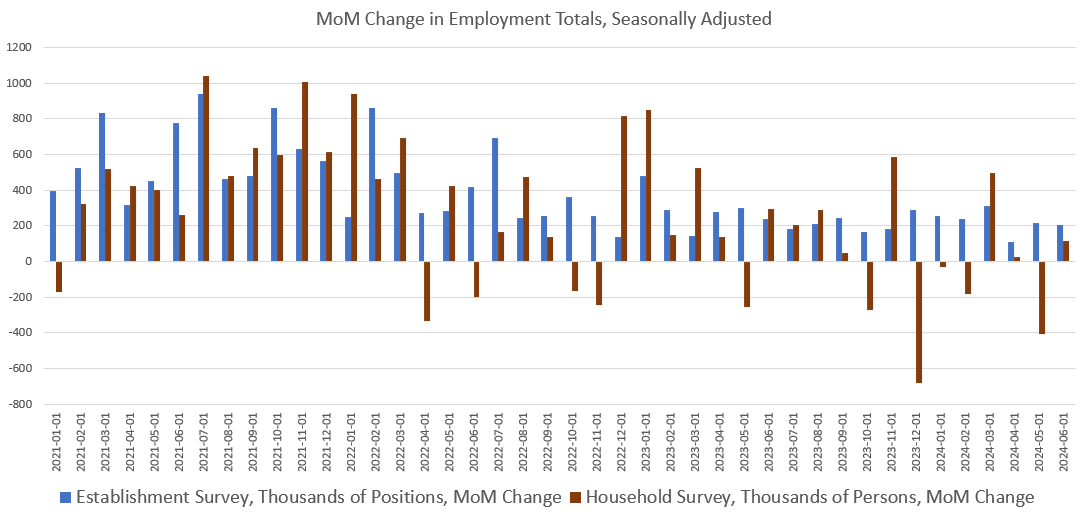
The establishment survey report shows that total jobs—a total that includes both part-time and full-time jobs—increased, month over month, in June by 206,000. The establishment survey measures only total jobs, however, and does not measure the number of employed persons. That means that even when job growth comes mostly from people working multiple part-time jobs, the establishment survey shows big increases while the total number of employed persons does not. In fact, total employed persons can fall while total jobs increases. For instance, the total number of employed persons has fallen in three of the past six months, while “total jobs” has increased in every month. In all but one of those six months, “jobs” grew significantly more than total employed persons. In June, as total jobs rose by 206,000, total employed workers rose by only 116,000 people.
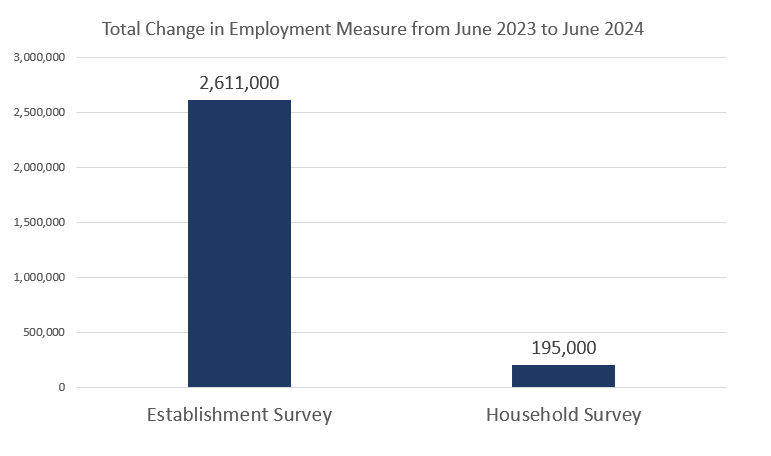
In fact, total household employment has risen by only a small fraction of the total number of new jobs. That is, total employed persons rose by 195,000 from June 2023 to June 2024. At the same time, total jobs (as measured by the establishment survey) rose by more than ten times as much: 2.6 million.
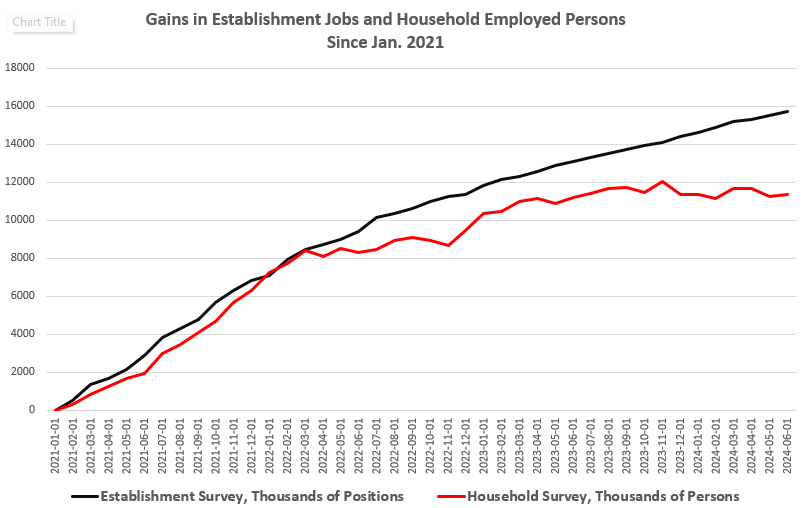
Moreover, if we look at the total increase in both measures over the past three years, we find a gap has opened and persisted over more than two years. Indeed, as of the June report, the gap is at 4.3 million. In other words, since January 2021, the establishment survey has shown by nearly 16 million new jobs while the household survey has shown less than 12 million new employed persons. The graph of this gap shows how growth in employed persons has nearly flatlined over the past year:
(Which survey offers a better picture? Bloomberg’s chief economist Anna Wong suggests the establishment survey is suspect.)
Assuming that the establishment survey is a realistic picture of the economy at all—an assumption that looks increasingly tenuous—then the current economy is producing many more jobs than actual workers.
A Recession in Full-Time Jobs
In many cases, it is indeed plausible that the economy is adding more jobs than it is adding workers. This can be seen in how the economy is apparently adding far more part-time jobs than it is adding full-time jobs. In fact, the economy is rapidly shedding full-time jobs, and full-time job measures point to recession.
Over the past year, as total employed persons has stagnated—and total jobs increased 2.6 million—we find primarily growth in part-time jobs. Over that same year, total part-time jobs increased by 1.8 million. During the same period, full-time jobs fell by 1.5 million. Net job creation during that period has been all part-time. In the month of June alone, workers reported a gain of 50,000 part-time positions while full-time jobs fell by 28,000.
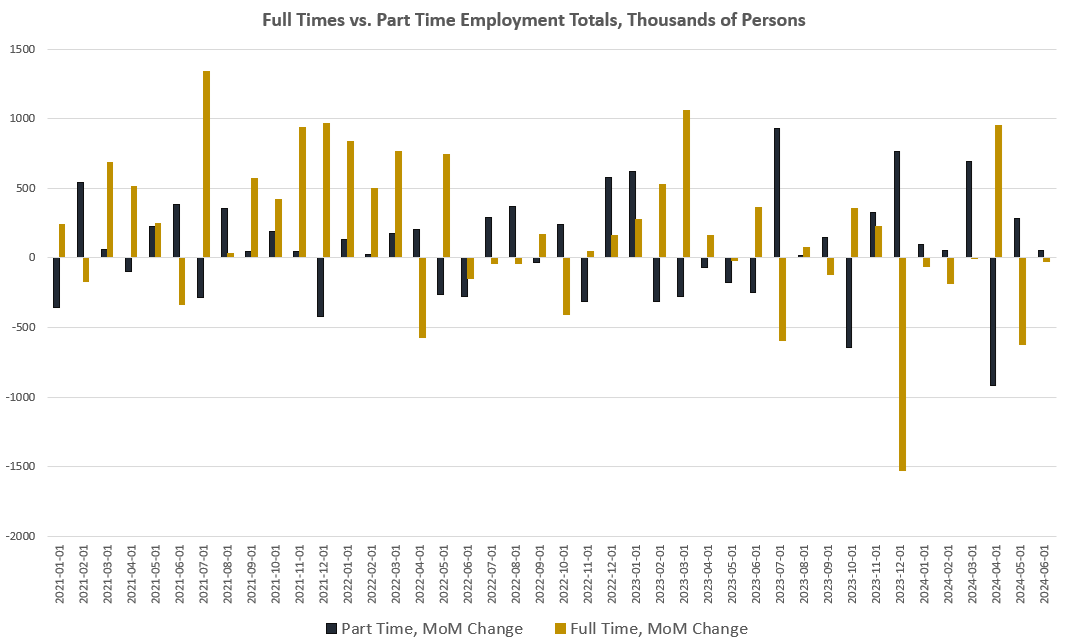
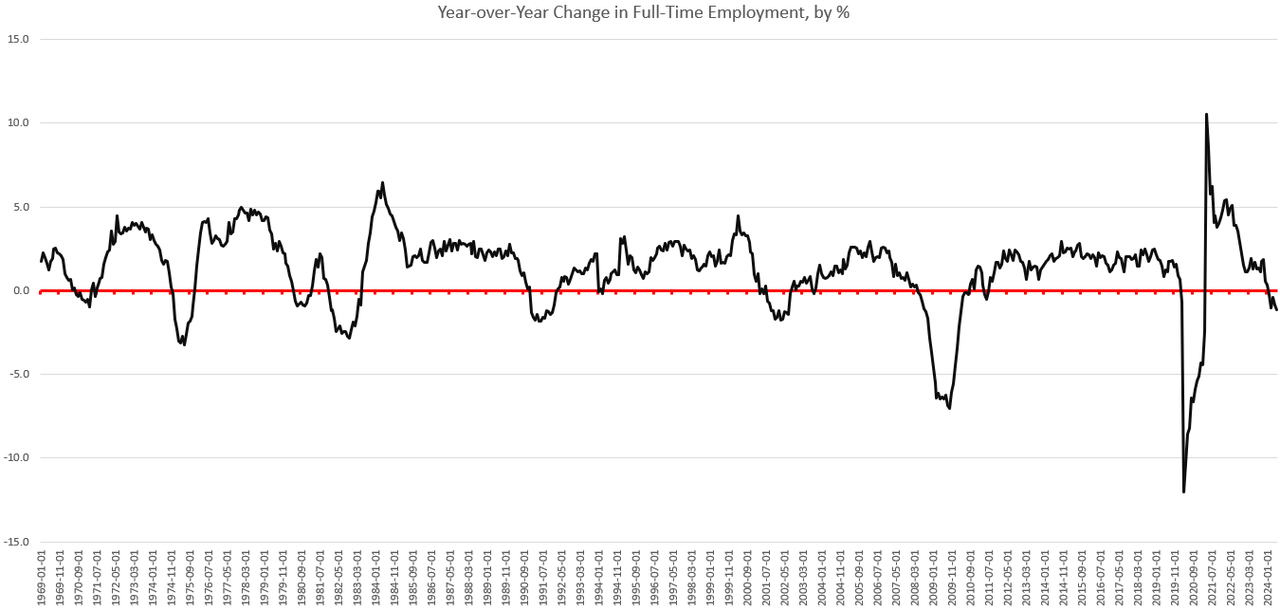
Year over year, total full-time employees fell 1.2 percent. Over the past three months, in fact, the year-over-year measure of full-time jobs has been in recession territory. Full-time jobs have now been down, year over year, in February, March, April, May, and June. Over the past fifty years, three months in a row of negative growth in full-time jobs has always been a recession signal and has occurred when the United States has been in recession, or about to enter a recession:
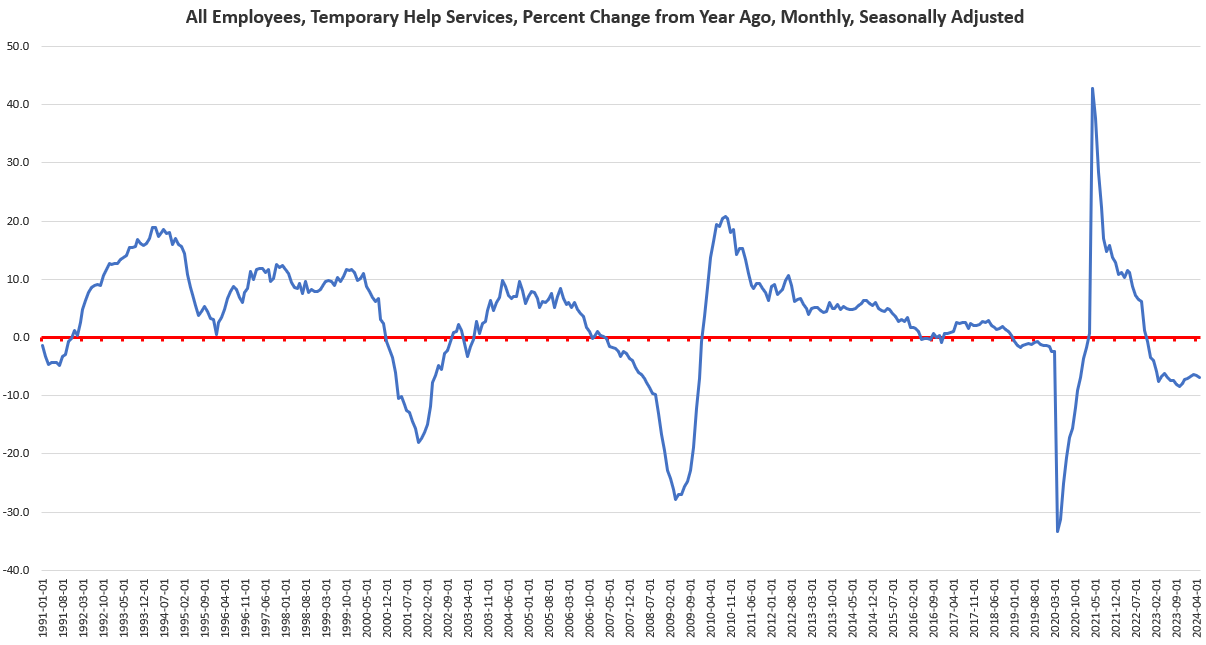
The full-time jobs indicator now reflects what we’ve seen in temporary jobs for months. For decades, whenever temporary help services are negative, year over year, for more than three months in a row, the US is headed toward recession. This measure has now been negative in the United States for the past twenty months. Temporary jobs in June were down by 7.7 percent, an eight-month low:
This is to be expected in a weakening economy. Empirical studies have shown that economies tend to shift to part-time work in times of economic downturn as a means of allowing employers more flexibility in reducing costs. This has been observed internationally, and not just in the United States.
If we take a larger look around, we find plenty of worrisome data in the leading indicators: The Philadelphia Fed’s manufacturing index is in recession territory. The same is true of the Richmond Fed’s manufacturing survey. The Conference Board’s Leading Indicators Index continues to point to recession. The yield curve points to recession. Net savings has now been negative for five months. (That hasn’t happened since the Great Recession.) The economic growth we do see is being fueled by the biggest deficits since covid.
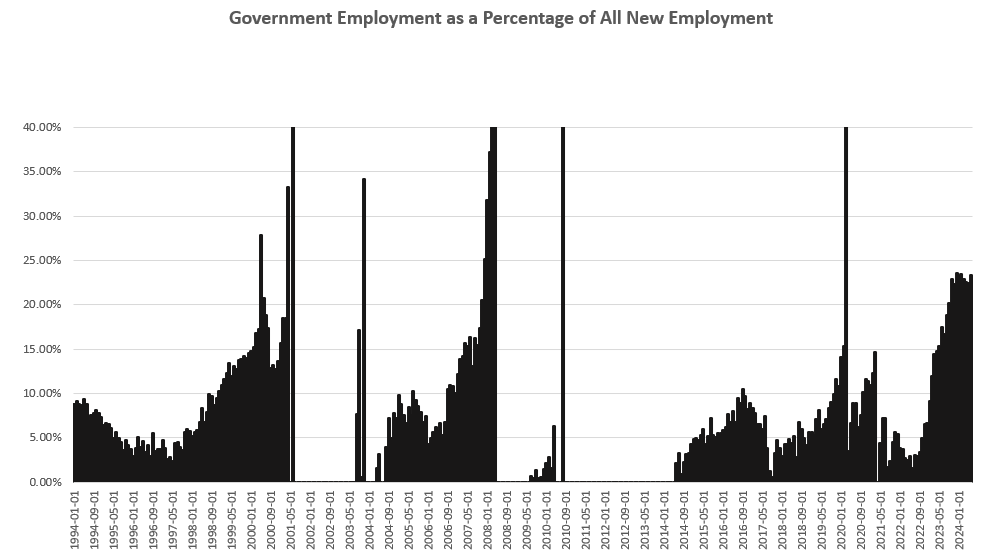
A final indicator that belies the narrative of “solid” job growth and economic stability is the situation with government jobs. When the US economy slides toward recession, government employment increases as a proportion of all employment. We have now seen this trend for the year. In June, government jobs were 23.2 percent of all employment. That’s the largest in five months. Historically, whenever this measure reaches above twenty percent for several months in a row, a recession is on the way. Government jobs have been more than twenty percent of new jobs for the past ten months:
Disclosure: no positions.
Editor’s Note: The summary bullets for this article were chosen by Seeking Alpha editors.

