Travel
Booking Holdings: Leading The Online Travel Agent Pack (BKNG)

Thomas Barwick/DigitalVision via Getty Images
Author’s Preamble
I have an actively managed investment portfolio and I regularly trade stocks within my investing universe (or watch list) depending upon the stock’s price relative to my estimate of its intrinsic value and its market trading patterns (technical indicators).
I share my valuations with readers as a way to get feedback and to gain new insights from other knowledgeable investors.
I have written previously about Booking Holdings (Cyclically Time to Lighten Up) and this is my annual update for the stock which incorporates all the company’s financial information at the end of Q1 FY2024.
Company Description
Booking Holdings (NASDAQ:BKNG) has grown over the years both organically and by generally small acquisitions.
The company has 3 reportable operating segments. At the end of the 1st quarter FY2024, the trailing 12-month revenues were:
Author’s compilation using data from Booking Holdings 10-Q and 10-K filings.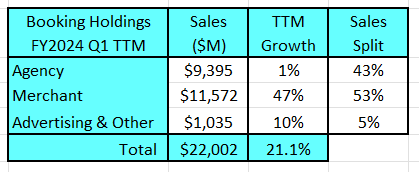
It is noted that the company does not provide a breakdown of each segment’s profitability.
The key takeaway from this table is that Merchant revenues are now the key source of growth.
Merchant revenues exceeded Agency revenues on an annualized basis for the first time at the end of Q3 FY2023.
Online Global Travel Market
According to Custom Market Insights, at the end of FY2023, the online travel market worldwide had gross travel revenues (GTV) of $546 Billion and the market is expected to grow at 12% per year through to FY2032.
If we look only at the listed online travel agent (OTA) market participants, the 10 largest globally listed companies in terms of FY2023 reported revenues (reported revenues not GTV revenues) are shown in the following table:
Author’s compilation using screening data from GuruFocus.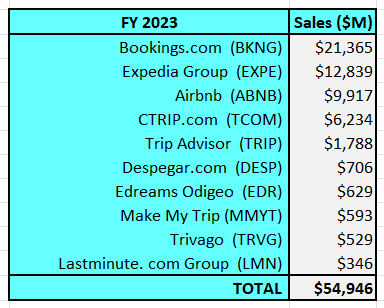
The ratio between reported company revenues and reported gross travel revenues (GTV) for Bookings, Expedia and Airbnb is between 12% to 14% (this is called the take rate).
We can estimate the combined market share of these 10 companies by dividing their average take rate into the cumulative revenue. I estimate that the 10 largest companies account for a GTV of $423 Billion, which gives them a combined market share of 78%.
I have compiled a time series of aggregate reported revenues for these companies for the last 10 years:
Author’s compilation using data from GuruFocus.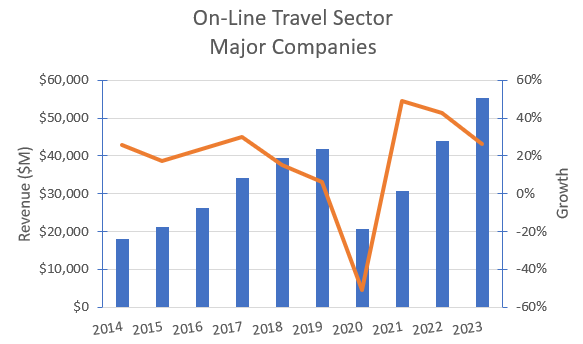
The COVID pandemic had a major negative impact on the sector’s revenues, but that impact appears to have now been “washed” out. Aggregate revenue growth for these companies over the last 10 years has been 13% per year.
My analysis indicates that the projected growth rates for the sector are in line with the historical norms.
Business Overview
Bookings’ revenues come from 5 sources:
- Merchant revenues and customer processing fees when products are sold directly to consumers.
- Agent commissions from service providers.
- Selling advertising on their website and mobile apps.
- Reservation revenues and subscription fees for restaurant management services.
- Commissions from selling ancillary services directly to consumers.
Bookings was a first mover in the Online Travel (OTA) market, and consequently, its brands enjoy strong consumer support. One of the company’s key differentiators early on was in its unique choice of market strategy (the agency model).
As a result of their approach to suppliers and consumers, Bookings was able to grow its partner base very rapidly (it became particularly popular with smaller suppliers and therefore its product offering was relatively different from its competitors) and revenues grew faster than the sector average.
By FY2018, Bookings realized that its agency strategy was running out of steam and a new strategy called a “connected trip” would be required to drive the next leg of revenue growth.
The new strategy had 3 elements:
- Increasing its value proposition by providing a whole trip product offering (air travel, accommodation, car hire, local attractions, restaurants, etc.).
- Grow alternative accommodation inventory in order to combat the growth of competitive tension from Airbnb.
- Update its payments platform in order to make the payments process more efficient.
This strategic shift saw a significant shift in the revenue mix towards the merchant model. This can be seen in the following chart, which shows the revenue split by model until the end of Q1 FY2024:
Author’s compilation using data from Booking Holdings’ 10-Q and 10-K filings.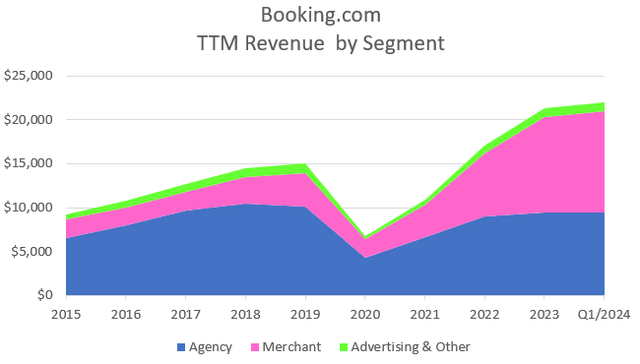
Although the company does not show the margin breakdown by sales model, the company has stated that the merchant approach has lower margins than the agency model.
Bookings provides data on the number of room nights, airline tickets and car rentals that it sells. The following chart shows the movement in this mix:
Author’s compilation using data from Booking Holdings’ 10-Q filings.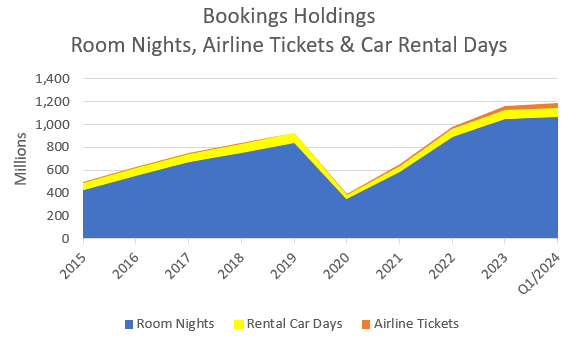
The company does not provide any information about its revenues or margins at a product level (nor do its competitors).
Booking Holdings’ Historical Financial Performance
Revenues and Operating Margins
An earlier chart showed the changing nature of Bookings’ revenue mix. Pre-COVID revenues had a 5-year CAGR of 12% but post-COVID the growth trajectory appears to be slowing.
Author’s compilation using data from Booking Holding’s 10-Q and 10-K filings.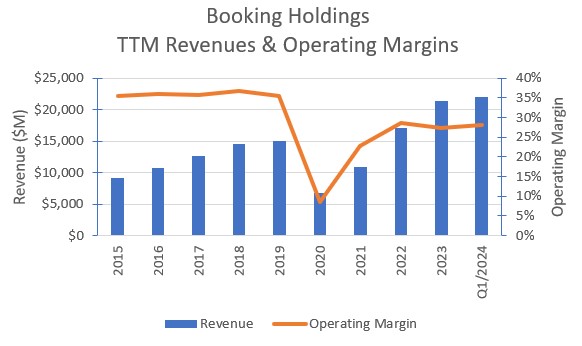
Although revenue growth appears to be slowing (although this may be influenced more by macro factors), the bigger concern is the lack of operating margin recovery back to pre-COVID levels.
The shift from agency transactions to merchant transactions appears to come with higher operating costs. These costs are associated with a range of items such as call center operations, payment processing, digital service taxes, credit losses and fraud protection.
Although Bookings’ margins are currently lower than historical levels, they remain significantly higher than Expedia and Airbnb, but the gap is closing.
Cash Flows
The following table summarizes Bookings’ cash flows for the last 10 years:
Author’s compilation using data from Booking Holdings’ 10-K filings.
The table highlights how little traditional reinvestment is required in this business. Only 6% of revenue has needed to be reinvested back to sustain the business (this is remarkably low and may indicate that some currently expensed items are really of a capital nature).
Over the last 10 years, Bookings has increased its leverage by $10,599 M. This debt has been used to substitute for equity in the capital structure, with the resulting freed up cash being returned to shareholders.
In summary, Bookings has generated $50,677 M of free cash for equity holders. It has distributed $39,303 M back to shareholders through buybacks and the remaining cash has been banked.
If the business only needs a low level of reinvestment, it may call into question the sustainability of high revenue growth and high operating margins. Can a company’s sustainable competitive advantage be maintained without adequate reinvestment?
Almost 40% of revenues are returned to shareholders as free cash flow. In my investing universe, I have only identified one other company which exceeds this amount (Mastercard).
Bookings generates a spectacular amount of cash and recently paid a dividend for the first time. This is often a signal that the company is entering a new maturing phase of its evolution, where growth may start to taper.
Capital Structure
The following chart shows the history of Bookings’ capital structure over the last 10 years:
Author’s compilation using data from Booking Holding’s 10-K filings.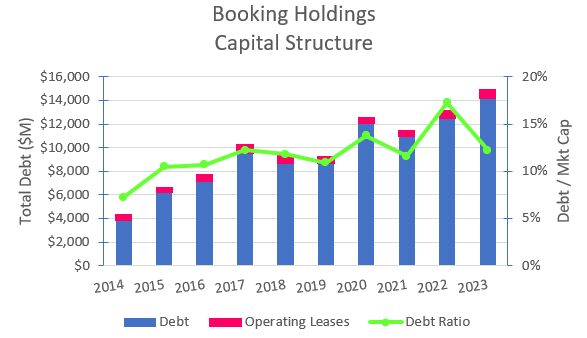
The chart shows that Bookings has increased its level of debt in line with the expansion in the company’s market capitalization. This has ensured that the company’s debt ratio stays close to the sector’s median (around 10%).
Bookings’ cash flows could easily support a higher debt load, but due to the sector’s cyclical nature it is resisted by most companies. This decision results in Bookings (and many of its peers) having relatively high costs of capital.
Readers should be aware that in FY2020, Bookings issued convertible debt with a face value of $863 M. According to the notes in the Bookings’ financial statements the debt currently has a market value of $1,700 M (it is shown on the balance sheet at its face value).
In the final valuation, the difference between the debt’s face value and market value must be subtracted from the company’s equity value.
Return on Invested Capital
The following chart shows the history of Bookings’ return on invested capital (ROIC) over the last 10 years:
Author’s compilation using data from Booking Holding’s 10-K filings.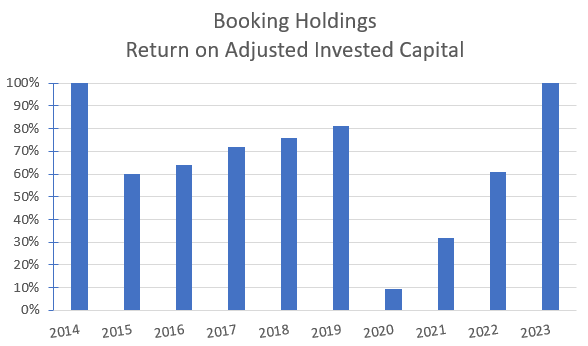
The chart highlights the negative impact that COVID had on the company’s earnings and consequently the ROIC. Clearly, the COVID impact has now been washed out of the data.
It is undeniable that the ROIC chart is spectacular, and the current level is extremely rare for a company of this size. A high ROIC is generally indicative of a strong, sustainable competitive advantage (or moat).
In previous articles, I have raised concerns about the sustainability of the Bookings competitive advantage. How can such a strong “moat” require so little reinvestment to sustain it in this era of rapidly changing technology?
This remains something for long-term investors to think about.
My Investment Thesis for Booking Holdings
The global travel market has the following broad characteristics. It is:
- cyclical.
- highly fragmented.
- mature.
The online travel agency (OTA) market is a subset of the travel market. It has been in existence for just over 20 years. The OTA growth has outpaced the total market’s growth because it has absorbed the market’s underlying growth and taken substantial share from traditional travel agents.
The OTA participants have significantly contributed to the ongoing consolidation of the overall market, but the law of large numbers is starting to impact the growth rates of the major OTA companies.
My scenario for Bookings is:
Growth Story
Bookings is the clear market leader in terms of size. Its financial strength will allow it to maintain this position. The revenue mix shift from agency to merchant revenues will continue into the future.
Growth is slowing, but it should remain between 10% to 14% on average over the next 5 years (not withstanding any significant global economic slowdown). It is noted that this is considerably higher than management’s guidance for FY2024 (high single digits).
Margin Story
Bookings’ margins have significantly declined post-COVID, which also corresponds with a mix shift from agency to merchant revenues. Although management does not provide any margin breakdown, I have assumed that a growing merchant revenue split will lead to lower long-term operating margins.
At this stage, I believe that Bookings will continue to gain some operating leverage from its size, and this will prevent margins declining to the levels of their major competitors. I am forecasting long-term margins of around 25%.
Growth Efficiency
I have previously commented on the low level of traditional reinvestment that Bookings (and its competitors) has in its business. I measure capital efficiency as the amount of revenue generated by every dollar invested into the business. Bookings currently has a ratio of 5.2.
I suspect that to maintain its high growth rate and remain the market leader, more investment will be required over time. This investment will be in the areas of technology and marketing / branding.
Some of the investment will be expensed (marketing and advertising) and this will contribute to lowering future margins, but some will be in the form of traditional capex. For this reason, I am forecasting a lower capital efficiency ratio.
Risk Story
Readers should remain wary of any significant deterioration in the global economy. Much of Bookings’ revenues are discretionary and will be impacted by a recession. I have not factored a recession into my forecast, but the sector’s cost of capital reflects the operational volatility that is observed within these businesses (it caused a higher unlevered beta).
I estimate that the typical costs of capital for this sector are in the highest quartile for publicly listed US companies. I am forecasting that Bookings’ long-term cost of capital will decline modestly but remain above the median for all US listed companies.
Competitive Advantages
Although Bookings has an extraordinarily high ROIC, I am not convinced that the company’s moat is very deep (although it might be quite wide). I suspect that the company may have marginally better technology than its competitors, but the business has been built on a non-traditional approach to the market (its agency model) and from superior marketing and branding.
I expect that more competitive pressure will come over time. The platform owners such as Google and Facebook remain the most serious threat, with an already established set of product offerings (Google Flights and Google Hotels).
Regional governments also present financial risks to Bookings. There is a growing tendency for governments to target large multinational software companies as soft targets for anti-competitive and privacy breaches, resulting in costly litigation actions.
Key Inputs into Booking Holdings’ Valuation
The following table reflects my inputs into the valuation:
Author’s summary of the key inputs into the valuation model.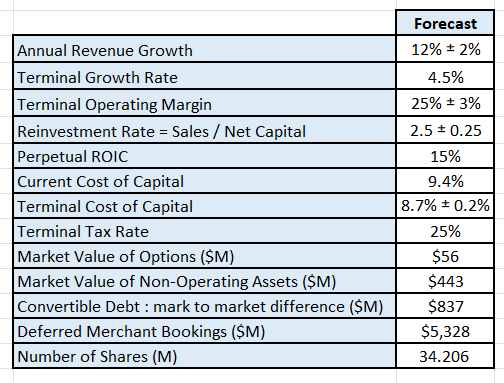
A couple of technical issues to be noted with the valuation inputs:
- I have assumed that the Netherlands’s lower tax arrangement will end within the next 10 years.
- I have treated the deferred revenue balance as a liability and therefore deducted it from the company’s valuation.
- I have accounted for the difference between the convertible debt’s face value and market value (this needs to be subtracted from the company’s valuation).
Discounted Cash Flow Model
A Free Cash Flow to the Firm approach is used with a 3-stage model (high growth, declining growth and maturity). The model only seeks to value the cash flows of the operating assets. The valuation has been performed in $USD.
The output from my DCF model is:
Author’s valuation model output. Author’s valuation model output.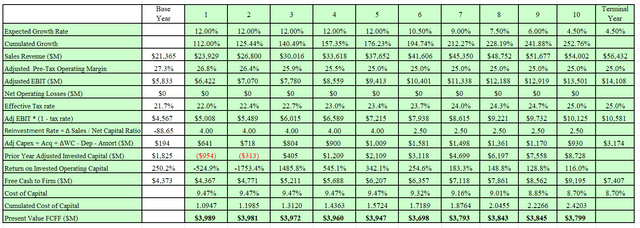
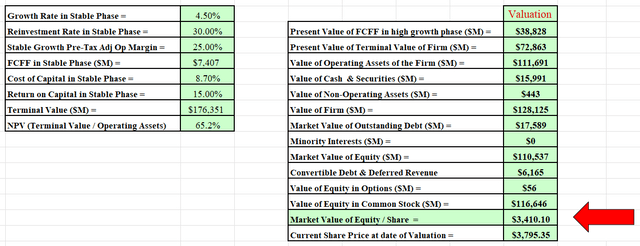
I also developed a Monte Carlo simulation for the valuation based on the range of inputs for the valuation. The output of the simulation was developed after 100,000 iterations.
Author’s valuation Monte Carlo simulation output.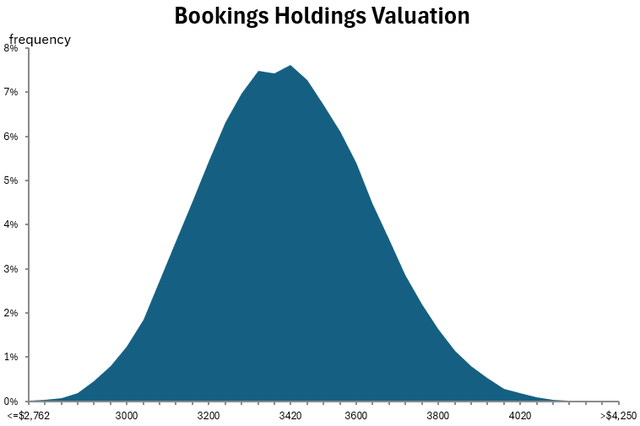
The Monte Carlo simulation indicates that 96% of the variation within the valuation estimate comes from the uncertainty associated with future revenue growth and the terminal operating margin. These are the keys to the valuation.
The simulation indicates that at a discount rate of 8.7%, Bookings has an intrinsic value of between $2,762 and $4,251 per share with an expected value of $3,410.
Based on my scenario, Bookings is currently priced at the upper end of my valuation curve.
Final Recommendation
The report has highlighted that Bookings is an outstanding generator of free cash for its shareholders. Their business model is characterized by high revenue growth with relatively high margins and requires low reinvestment to sustain it.
I have found very few other business models which generate the financial metrics similar to Bookings. This is a very special company.
My call is that Booking Holdings is currently a HOLD.
My assessment is in line with Seeking Alpha’s quant rating for Booking Holdings.
What are the risks going forward?
The valuation has identified that the key drivers of the valuation are the expected revenue growth rate and the terminal operating margin.
I have projected that margins will fall from the current levels, but they will remain significantly higher than their main competitors. Obviously, there is room for margins to fall further than my projection. This is something that investors need to monitor.
I suspect that the bigger risk to the valuation is in the future revenue growth. In the near term I am projecting higher growth than management’s guidance. The following table shows the impact of a lower long-term growth rate on the valuation:
Author’s “what if” compilation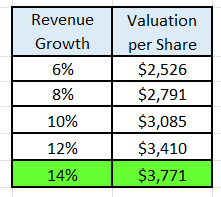
A lower level of long-term growth would probably be caused by the rise of a competitor (either a new competitor or an existing competitor, such as Google).
What should existing shareholders be doing?
Bookings has been an excellent long-term investment relative to its peers and the market index, as shown by the following table:
Author’s compilation using data from Yahoo Finance.
Given the excellent performance of the stock, there is a possibility that long-term holders of Bookings may be overweight the stock within their portfolio. Whilst the current price action for the stock remains reasonably bullish, investors may choose to continue to enjoy the ride but when the current rising trend breaks down, I recommend that holders:
- Ensure that their allocation is not overweight and make the appropriate adjustments to bring the holding back to their target allocation.
- Do not add to your holdings at current prices.
- If the stock has a reasonable pull-back to the lower half of my valuation range, then I would be buying it aggressively.


