Jobs
Jobs Data Dilemma

Kelly L
Real Estate Weekly Outlook
U.S. equity markets posted mixed performance while benchmark interest rates briefly dipped to two-month lows before retracing most the retreat late in the week as investors parsed a perplexing slate of employment data showing clear signs of cooling across essentially all metrics except for the “headline” payrolls print on Friday – the most consequential metric for policymakers – which both delayed the expected timeline for the Fed’s rate-cutting cycle and raised the prospects of a policy error resulting from conflicting or erroneous data.
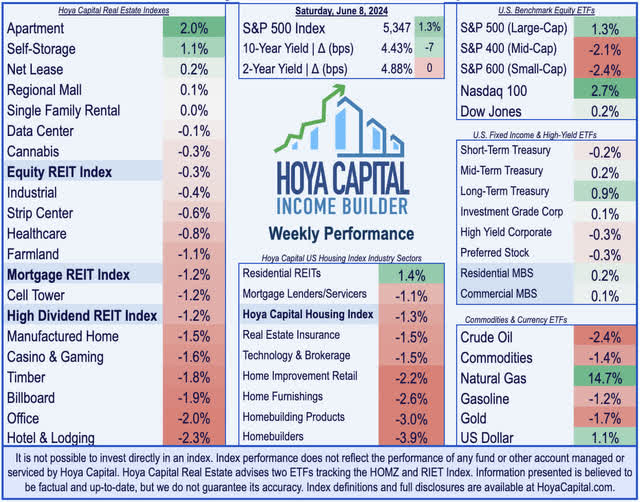
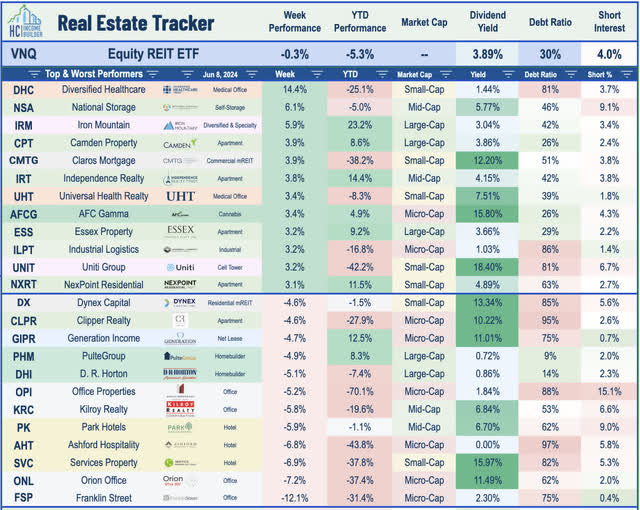
Following two weeks of modest declines, the S&P 500 posted another series of record highs en-route to gains of 1.3% on the week. Consistent with the theme since the start of the Fed’s rate hiking cycle in early 2022, however, the large-cap and tech-heavy benchmarks mask the pain felt by smaller-cap and more rate-sensitive segments of the market. The Small-Cap 600 stumbled 2.4% on the week – dipping back into negative territory for the year – while the Mid-Cap 400 slipped 2.1%. By comparison, the Nasdaq 100 – an index dominated by mega-cap technology firms – posted gains of nearly 3% this week to stretch their relative outperformance versus their small-cap peers to over 30 percentage points since the start of the Fed’s rate hiking cycle in March 2022. Real estate equities also lagged as the timeline for the long-awaited Fed pivot was pushed into late 2024, overshadowing an otherwise upbeat slate of business updates at REITweek. The Equity REIT Index slipped 0.3% on the week, with 13-of-18 property sectors in negative territory. Mortgage REITs slipped 1.2% while Homebuilders dipped nearly 4%.
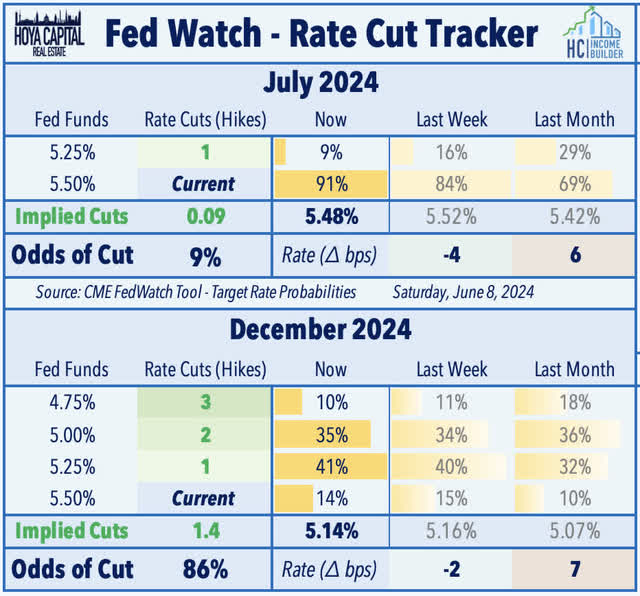
Bond markets were pacing for a strong week prior to the Friday morning jobs report, with the benchmark 10-Year Treasury Yield trading as low as 4.27% on Thursday – the lowest since late-March – before surging on Friday to close at 4.43%, which was still the lowest end-of-week close since March 29th. The policy-sensitive 2-Year Treasury Yield ended the week unchanged at 4.88%. Mirroring the trends in rate markets, WTI Crude Oil traded sharply lower early in the week after OPEC rolled out a plan to restore some production to the market this year by unwinding cuts, briefly trading below $73/barrel for the first time since February before a late-week rally to close around $75/barrel. While employment data was the major focus domestically, the European Central Bank and the Bank of Canada each announced this week that it would lower its reference interest rates by 25 basis points, becoming the first two Group of Seven nations to begin a post-pandemic rate cutting cycle. Following the hot payrolls print, the U.S. Fed is now expected to hold-off on cuts until September at the earliest. Swaps markets are now pricing in a 9% probability that the Fed will cut rates in July – down from 10% last week – and imply 1.4 rate cuts in 2024 – up from 1.2 last week.
Real Estate Economic Data
Below, we recap the most important macroeconomic data points over this past week affecting the residential and commercial real estate marketplace.
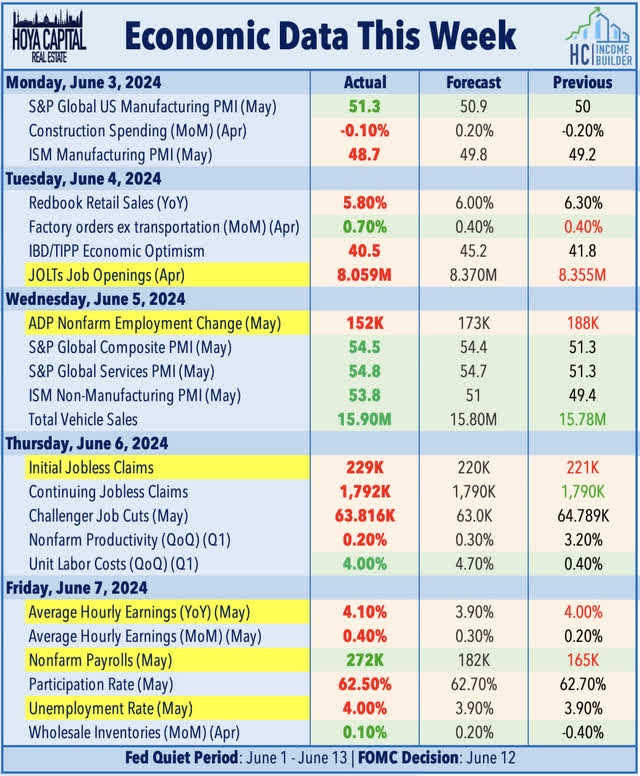
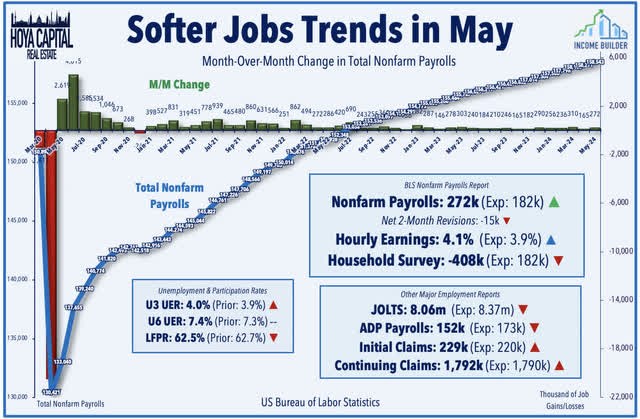
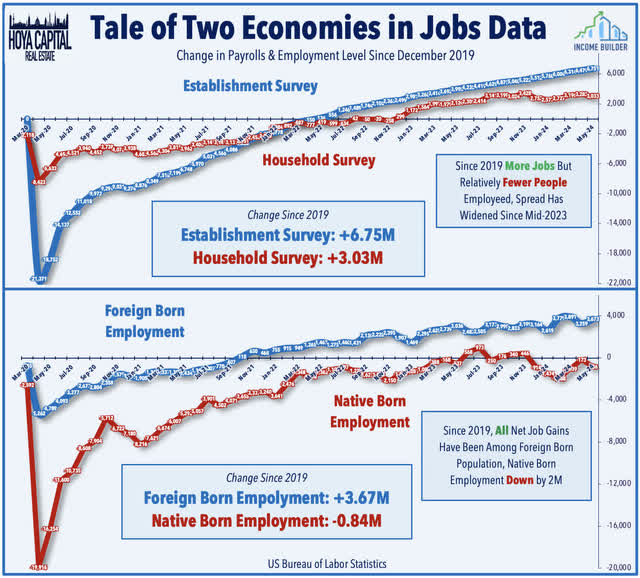
The critical BLS Nonfarm Payrolls report this week showed that the U.S. economy added 272k jobs in May – above consensus estimates of 182k – but consistent with the trend of the past several quarters, the report was quite a bit weaker under the surface than the headline metric would suggest. Net revisions subtracted 15k from the prior two months, while the BLS also announced substantial downward revisions to the past 18 months of data, raising legitimate questions about the reliability of the BLS’ methodology. Data across a handful of separate reports earlier in the week – as well as data contained with the BLS’ separate household survey – showed more definite signs of labor market softness. The monthly Job Openings and Labor Turnover Survey (“JOLTS“) showed that total Job Openings fell to 8.06M last month – the lowest level in three years and considerably below consensus estimates of 8.4M. ADP reported that private payrolls rose by 140k in May, which was below the consensus of 173k. Jobless Claims data, meanwhile, showed that initial unemployment filings rose to 229k last week – lifting the four-week moving average to the highest level since last September – while continuing claims are back above pre-pandemic levels of around 1.8 million.
The Household Survey – which is used to calculate unemployment metrics – has been considerably weaker than the Establishment Survey – which is used to calculate the “headline” job gains. The Household Survey – which admittedly has been quite noisy and has given several “false alarms” – showed a -408k decline in the employment level in May – which led to a rise in the unemployment rate to 4.0% from 3.9%. The Household Survey also showed some rather remarkable splits in job gains between Native and Foreign-born workers. While it’s again worth noting that the BLS’ population-characteristics metrics are prone to large revisions, the report this week showed that the foreign-born employment level rose by 414k in May, while the native-born population level plunged by 663k during the month. While noisy, this dynamic is consistent with the longer-term trends, which show that all of the net job growth since 2020 has come via Foreign-Born workers, while the Native Born population has also lost nearly 1 million jobs over the past four years.
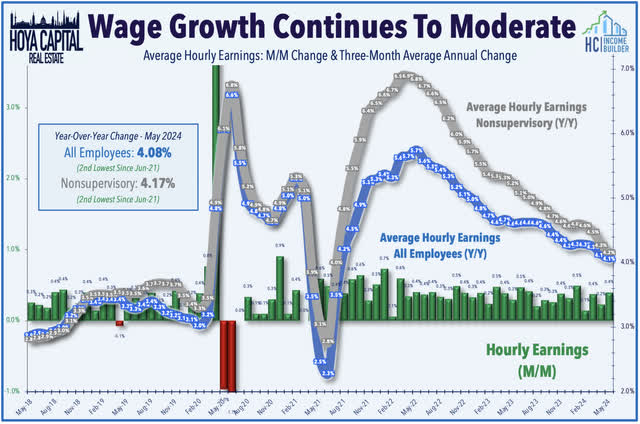
Average hourly earnings (“AHE”) – a key inflation indicator – provided additional evidence of normalizing labor market conditions following pandemic-era shortages. AHE for all employees moderated to a 4.1% year-over-year increase in May – the second softest since June 2021 – and moderated to 4.2% for non-supervisory workers, down sharply from the peak of around 7% in early 2022. Since the start of 2023, AHE for all employees has averaged 4.0% on an annualized basis – which is still slightly above the 3.3% increase in 2019 in a year when CPI inflation averaged just 1.8%. ADP also reported that its measure of annual pay posted its smallest annual gain since September 2021 at 5.0%. Job changers saw wage increases of 7.8% – down from 9.3% in the prior month. Separately, ISM released its Manufacturing PMI report, showing surprising softness in May – particularly in its new orders and prices paid sub-indexes. Manufacturing PMI dipped to 48.7 in May – well below estimates of around 50 and down from 49.2 in April – and notched its 18th contraction in the past 19 months. Important to the inflation outlook, its Prices Index fell nearly 4 points in May to 57 – reversing much of its early-2024 reacceleration.
Equity REIT & Homebuilder Week In Review
Best & Worst Performance This Week Across the REIT Sector
REITweek, the annual REIT industry conference, was held this week in New York City. Humbled by two years of rate-driven headwinds, the venue halls at the Midtown Hilton were as quiet as any REITweek in recent memory. Excitement was muted after numerous “false starts” on the long-awaited Fed pivot, a dearth of IPO and M&A activity, and a two-year period of significant underperformance versus the broader market. In our updated State of REIT Nation report, we noted that since the start of the Fed’s rate hike cycle in March 2022, the REIT Index has underperformed the S&P 500 by a whopping 40 percentage-points. Tempered optimism was the prevailing sentiment among REIT executives, however, with most noting steady-to-strong property-level fundamentals, but also an uptick in debt-driven distress among some of their private market peers. “Delay and pray” has remained the strategy for many highly-levered property owners amid a dearth of buying interest and limited capital availability. Public REITs have opted to remain on the sidelines, but there was shared sentiment – even among private market players – that opportunities for public REITs will emerge as private markets bottom-out.
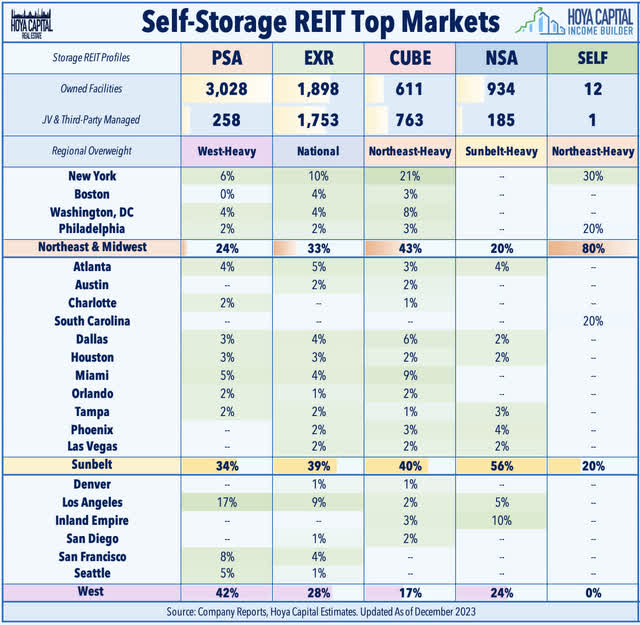
Self-Storage: Among several notable REITweek updates, National Storage Affiliates (NSA) – the fourth-largest storage REIT – rallied 6% this week after it announced plans to internalize its participating regional operating (“PRO”) structure – which represents 32% of NSA’s 1,050 managed properties – in a move that NSA says will position the firm for “accelerated earnings growth in 2025 and beyond.” The Sunbelt-focused storage operator leaned heavily on this joint-venture structure to fuel rapid growth since its IPO in 2015, and NSA had previously consolidated a handful of these PRO partners in recent years. NSA expects the internalization to be accretive to FFO/ share by approximately $0.03 – $0.04, primarily due to annual G&A savings. As part of the transaction, NSA expects to acquire the PROs’ management agreements and will no longer pay any supervisory and administrative fees. After the completion of the management transition, NSA will directly manage the vast majority of the former PRO properties and expects to realize approximately $7.5 – $9.0M of annual G&A savings. Consistent with prior internalizations, NSA expects to purchase the PRO management contracts at a valuation of 4x EBITDA, which will total $85- $90M in cash and new OP units. NSA commented that the “long-term vision for NSA always contemplated the eventual internalization of the PRO structure, and current market conditions make today the right time for a win-win scenario for common shareholders and PROs alike.”
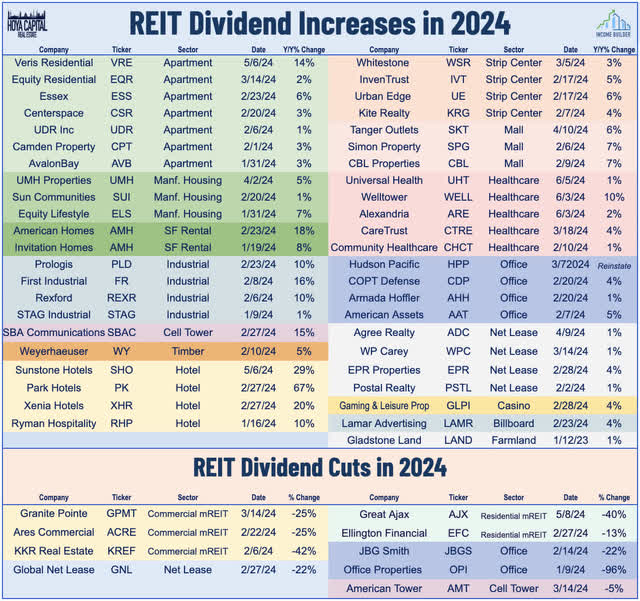
Healthcare: Senior Housing REIT Welltower (WELL) was little-changed this week despite raising its full-year outlook for the second time in a month. Citing “robust and accretive capital deployment activity” over the past month, WELL now expects full-year FFO growth of 12.9% – up from its prior upwardly-revised guidance in April of 12.2%. Since its prior update in April, WELL made $1.0B of investment, in addition to the $2.8B closed or under contract. WELL also reached an agreement with Atria to transition 89 Atria-operated communities – which WELL acquired in 2021 – to six of its existing regional operators, a move that WELL expects to generate “meaningful NOI growth through occupancy upside and completion of portfolio-wide renovation program.” WELL maintained its overall property-level guidance, commenting that “seniors housing fundamentals remain healthy entering peak leasing season” with “notable strength in non-same store properties, with recently transitioned assets generating stronger than anticipated results.” WELL expects robust same-store NOI growth of 19.5% for its critical Senior Housing Operating Property (“SHOP”) segment. Separately, WELL also increased its quarterly dividend by 10% to $0.67/share (2.6% dividend yield). Fellow healthcare REIT Alexandria (ARE) also hiked its dividend this week by 2% to $1.30/share (4.4% dividend yield), while Universal Health (UHT) raised its dividend by 1% to $0.73/share (7.6% dividend yield).
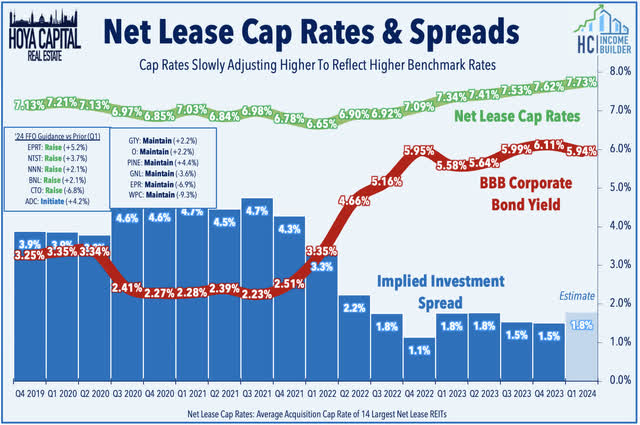
Net Lease: Realty Income (O) – the largest net lease REIT – gained 0.5% on the week after it raised its full-year guidance. Citing “an improving investment environment, particularly in Europe,” Realty Income now expects to achieve full-year AFFO growth of 3.5% – up 10 basis points from its prior forecast of 3.4%. Possibly indicating an M&A deal in the works, Realty Income also raised its 2024 investment volume forecast by 50% to $3.0 billion, as compared to its previous guidance of $2.0 billion. Realty Income held steady its guidance for its property-level metrics, including its forecasted occupancy rate of 98% and same-store rent growth of 1.0%, commenting that it sees “stable operating performance” across its global portfolio. Elsewhere in the net lease space, Essential Properties (EPRT) advanced 2.5% after it hiked its dividend by 2% to $0.29/share (4.3% dividend yield). Elsewhere, casino-focused net lease REIT Gaming and Leisure Properties (GLPI) slipped 2.5% after it announced a $111M deal to fund and oversee a hotel renovation of Belle of Baton Rouge for its tenant The Queen Casino and Entertainment Inc. GLPI will own the new facility and Queen Casino & Entertainment Inc. will pay an incremental rental yield of 9% on the development funding beginning a year from the initial disbursement of funds, which occurred on May 30, 2024.
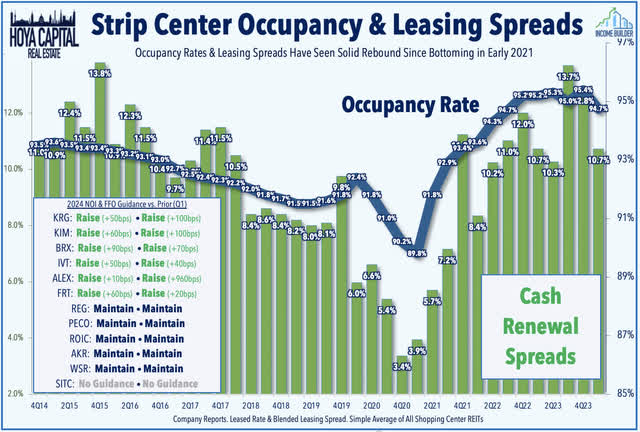
Strip Center: Federal Realty (FRT) was little-changed this week after it announced a series of property-level transactions, headlined by a $215M deal to acquire Virginia Gateway, a 665k square-foot retail center spanning 110-acres in Gainesville, Virginia – a suburb of Washington DC. The property is approximately 95% occupied and ranks third in Virginia for annual visits, according to Placer.ai, just behind Tysons Corner. FRT notes that the average household income within a three-mile radius of the property exceeds $184,000, above its in-place portfolio average. With the addition of the property, FRT’s Northern Virginia portfolio grows to 3.6 million square feet, and roughly a third of FRT’s total portfolio is in the metro DC market (DC, VA, MD). Later in the week, FRT announced that it sold the remaining assets of its Third Street Promenade in Santa Monica, California, for $103M. As noted in our Earnings Recap, strip center REITs reported solid first-quarter results, but there were some indications of waning upside momentum. Occupancy rates declined slightly from the record-high levels in the prior quarter, while leasing spreads cooled slightly to around 11%, down from nearly 14% in mid-2023.
2024 Performance Recap
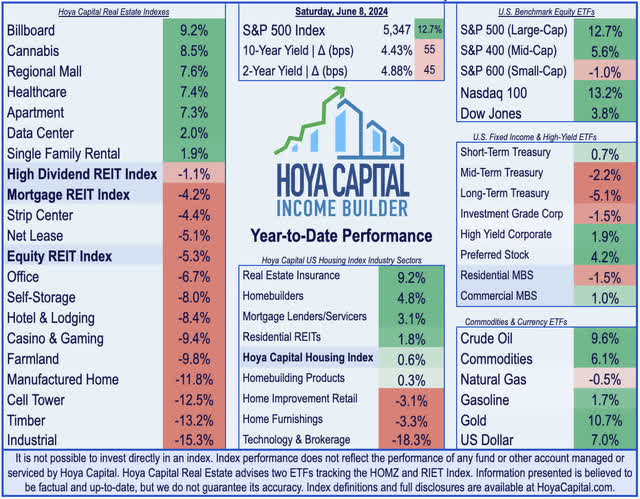
As we approach the halfway point of 2024, real estate equities have continued to lag behind the broader equity benchmarks following a powerful year-end rebound in 2023. The Equity REIT Index is lower by -5.3%, while the Mortgage REIT Index is lower by -4.2%. This compares with the 12.7% gain on the S&P 500, the 5.6% gain for the Mid-Cap 400, and the -1.0% decline for the Small-Cap 600. Within the REIT sector, 7 of the 18 property sectors are higher for the year, led by Mall, Healthcare, and Apartment REITs – while Industrial and Cell Tower REITs have lagged on the downside. At 4.43%, the 10-Year Treasury Yield is higher by 55 basis points on the year, while the 2-Year Treasury Yield has risen 45 basis points to 4.88%. Following a late-year rally in the final months of 2023, the Bloomberg US Bond Index is lower by -1.2% this year, and within the bond sector, credit has significantly outperformed duration. Fueling renewed inflation headwinds, WTI Crude Oil is higher by 9.6% this year, lifting the Commodities complex by 6.1%.
Economic Calendar In The Week Ahead
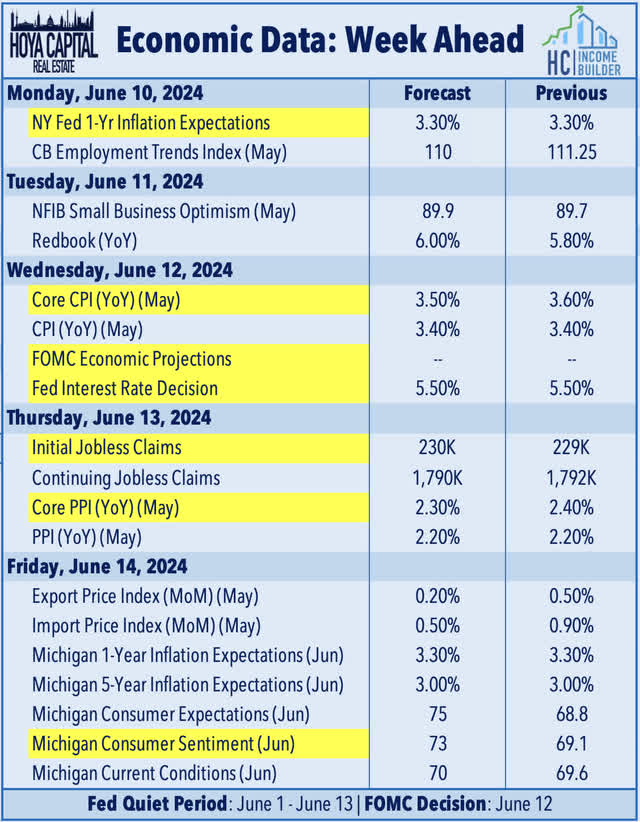
All eyes will be on the Federal Reserve in the week ahead. While the FOMC will almost surely hold benchmark interest rates steady at the current 5.5% upper bound, investors will be focused on updated economic projections – including the “dot plots” from FOMC members – and commentary from Fed Chair Powell for indications on how recent hot inflation data has altered their prior median forecast calling for three rate cuts this year. A critical slate of inflation data flanks the FOMC’s rate decision. The main event comes on Wednesday morning with the Consumer Price Index for May, which investors and the Fed are hoping will show a cooling of inflationary pressures after seeing a reacceleration in the year-over-year rate in two of the past three months. The Core CPI is expected to moderate to a 3.5% year-over-year rate – down from 3.6% last month. We’ll likely see some moderation in the critical shelter component, and relief in gasoline prices – the key “swing” inflation input – which was marginally lower in May following three months of sequential increases. Gas prices nationally averaged $3.46/gallon on Friday – down 5% from a month earlier, but still up about 10% since the start of 2024 and are up nearly 50% from January 2021. On Thursday, we’ll see the Producer Price Index, which had been showing more encouraging disinflation trends over the past year due to its skew towards goods-oriented inputs, but this dynamic has leveled-out in recent months amid a rebound in commodities prices. Core PPI is expected to tick lower to 2.3% in April from 2.4% in the prior month. We’ll also get our first look at June Consumer Sentiment data from the University of Michigan, which is expected to rebound slightly following a plunge in May amid concern over gasoline prices and lingering inflation.
Disclosure: Hoya Capital Real Estate advises two Exchange-Traded Funds listed on the NYSE. In addition to any long positions listed below, Hoya Capital is long all components in the Hoya Capital Housing 100 Index and in the Hoya Capital High Dividend Yield Index. Index definitions and a complete list of holdings are available on our website.


