Jobs
Breakeven Employment Growth – San Francisco Fed

Millions of jobs were lost during the height of the COVID-19 pandemic in 2020. U.S. employment growth bounced back strongly in 2021, averaging 604,000 jobs per month. These rapid job gains were unsurprising, as the labor market dug out of the deep hole created by the pandemic. However, the initial recovery stretched into a robust expansion, adding 205,000 jobs per month on average in 2023. This is well above past estimates of trend or breakeven employment growth—defined as the pace needed to keep the unemployment rate stable—which is typically estimated as 70,000 to 90,000 jobs per month (Bidder et al. 2016). Despite this excess job growth, the unemployment rate has not declined, remaining very near its long-run value of 3.8% since early 2022.
This Economic Letter uses the concept of breakeven employment growth to improve our understanding of recent job growth numbers. The breakeven rate fundamentally depends on growth in the size of the labor force and can differ over the short run and long run. Recent long-run employment growth estimates range from 70,000 to 90,000 new jobs a month. By contrast, short-run estimates currently range from 130,000 to 220,000, depending on assumptions regarding recent and near-term immigration flows. Recent analysis by the Census Bureau and Congressional Budget Office (CBO) suggests that immigration has been an important factor behind these large employment gains. According to a baseline projection of labor force growth and assuming that past unemployment rates and other economic conditions remain stable, we find that current short-run breakeven employment growth is roughly 130,000 and is expected to decline to a long-run value of just under 100,000 by the end of 2025.
Defining breakeven employment growth
The unemployment rate has stayed very close to its long-run level of 3.8% since early 2022, while monthly job gains have consistently outpaced past trends for breakeven employment growth. Before the pandemic, monthly payroll growth consistent with maintaining unemployment at its long-run value was generally considered to range from 70,000 to 100,000 (see Bidder et al. 2016). Over the six months prior to May 2024 however, monthly job growth averaged 242,000 without significant changes in the unemployment rate. This extended period of elevated job growth has raised questions about the need to reassess the level of breakeven employment growth. In other words, could the pandemic have led to longer-term structural changes that affected normal labor market patterns?
Simply stated, the size of monthly job growth needed to avoid a change in the unemployment rate depends only on the size of labor force growth. Say, for example, the labor force is adding 100,000 individuals per month and the unemployment rate is currently at 4%. The economy would need to create 96,000 jobs to break even with labor force growth and avoid any change in the rate of unemployment. A faster pace of job growth will push the unemployment rate down because people are finding jobs faster than the labor force is growing. However, if job growth falls short of that number, the unemployment rate will begin to rise.
As with several benchmark indicators of economic activity, such as the natural rate of unemployment (see Crump et al. 2020), there is a short-run and long-run concept of breakeven employment growth associated with specific horizons for trends in labor force growth. The long-run concept, quite naturally, follows long-run trends in the level of the labor force and its projections for the future. The short-run concept reflects cyclical variation in labor force growth, fluctuating with business cycle expansions and recessions around its long-run trend.
Estimates of trend labor force growth
The Current Population Survey (CPS) conducted by the Bureau of Labor Statistics provides an official monthly estimate of the number of people over age 16 in the labor force—that is, the number of people either employed or actively looking for work. Figure 1 shows the size of the actual labor force (blue solid line) using the underlying CPS microdata, which at the time of analysis were available from January 1976 to April 2024. We use additional information from the CBO and Census population forecasts to project the future size of the labor force.
Figure 1
Actual and projected labor force
The dashed lines in Figure 1 show projections for the labor force beyond April 2024 based on three scenarios. A baseline scenario uses the baseline U.S. Census resident population projections by age, gender, and race or ethnicity along with group-specific CPS estimates of trend labor force participation (LFP) rates in April 2024. This allows us to build a projection for the labor force through 2035 (blue dashed line).
We also incorporate projections for the impact of immigration on the future labor force. The second scenario is constructed using a similar approach to the baseline but uses a high immigration scenario from the Census Bureau for population projections by age, gender, and race or ethnicity (green dashed line). The third scenario uses the CBO’s most recent age 16-plus civilian noninstitutionalized population estimates and projections under a high immigration scenario (red dashed line). This scenario reflects recent higher immigration estimates based on Department of Homeland Security data from 2021 to 2023, along with the overall LFP rate implied by the Census high immigration scenario. The CBO high immigration scenario projects that the pace of immigration estimated for 2023 will persist through 2024, slowing rapidly thereafter back to levels more consistent with historical trends (see CBO 2024 for more details).
We estimate trends in the size of the labor force using a statistical approach known as a band-pass filter to smooth the actual data over specific periods. The long-run trend in the labor force is defined as movements at the 40-year or longer horizon, while short-run labor force trends focus on movements as frequent as every six months. Long-run trend labor force growth is estimated to be around 72,000 per month in 2024 in the baseline scenario. The higher immigration scenarios imply a somewhat faster long-run pace of labor force growth of around 90,000 to 95,000.
The short-run trends pick up more of the recent dynamics in the labor force. Short-run trend labor force growth is estimated to be around 145,000 per month in the first quarter of 2024 under the baseline projection and similar under the Census high immigration scenario. But the CBO high immigration scenario, which includes adjustments to the estimated size of the labor force over the past three years, is significantly higher at 240,000 per month.
Long- and short-run breakeven employment growth
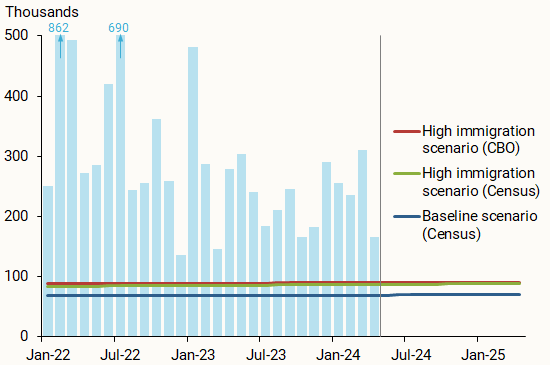
Our baseline calculations assume a long-run unemployment rate of 3.8%. The results are shown in Figure 2 for long-run employment growth and Figure 3 for short-run employment growth. Long-run breakeven employment growth is estimated to range between 70,000 and 90,000 jobs per month in 2024, even after taking into account recent higher-than-expected labor force growth and projections for higher immigration scenarios from Census and the CBO (green and red lines in Figure 2, respectively).
Figure 2
Long-run monthly breakeven employment growth
Source: Bureau of Labor Statistics, Census, CBO and authors’ calculations.
Figure 3
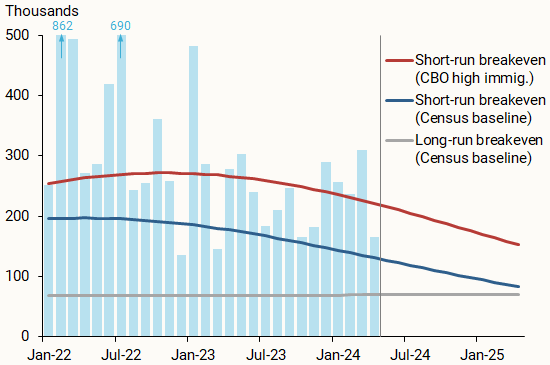
Short-run monthly breakeven employment growth
Source: Bureau of Labor Statistics, Census, Congressional Budget Office, and authors’ calculations.
Short-run breakeven employment growth is estimated to be higher than long-run growth under each scenario, as shown in Figure 3. Under the baseline scenario, short-run breakeven employment growth is estimated to be around 140,000 jobs per month in the first quarter of 2024 (dark blue line). It is somewhat more elevated under the high immigration Census scenario at 151,000 jobs per month (not shown) and significantly higher at 230,000 jobs per month under the CBO high immigration scenario (red line), reflecting the recent surge in immigration that is projected to largely continue in the near term. Under the baseline projections, short-run breakeven growth will converge on the long-run breakeven growth rate (gray line) by the end of 2025. However, this return to the long-run trend stretches further out to 2027 for the CBO high immigration scenario.
These estimates are largely consistent with other contemporaneous work. Edelberg and Watson (2024), for instance, estimate the recent surge in immigration as estimated by the CBO caused an upward shift in short-run breakeven growth of 100,000 jobs per month in 2024, pushing the upper range of the estimate to 200,000 jobs per month (see also Feroli 2024). The estimates in Walker (2024) also are in concordance with our conclusions under the baseline scenario, with an estimate of long-run breakeven growth of 75,000 jobs per month, and a short-run breakeven rate of 125,000 per month in 2024.
Conclusion
The unemployment rate has been very near its long-run value since early 2022, while monthly job gains over the six months prior to May 2024 have consistently outpaced estimates of the breakeven employment growth that holds unemployment constant. This pattern has raised questions about whether the breakeven pace of employment growth has risen above past estimates. The analysis in this Economic Letter distinguishes between short-run breakeven employment growth, which depends on near-term labor market volatility, and long-run breakeven employment growth, which reflects more durable determinants of labor force growth. We find that the long-run breakeven pace of employment growth has changed little from prior estimates of just under 100,000 per month, after accounting for short-run dynamics of the business cycle and immigration. However, the short-run breakeven pace remains well above the long-run value for the time being, which explains the stability of the unemployment rate in the face of persistently high job growth.
References
Bidder, Rhys, Tim Mahedy, and Robert G. Valletta. 2016. “Trend Job Growth: Where’s Normal?” FRBSF Economic Letter 2016-32 (October 24).
Congressional Budget Office (CBO). 2024. The Demographic Outlook: 2024 to 2054. Report. Washington, DC.
Crump, Richard K., Christopher J. Nekarda, and Nicolas Petrosky-Nadeau. 2020. “Unemployment Rate Benchmarks.” Federal Reserve Board, Finance and Economics Discussion Series 2020-7.
Edelberg, Wendy, and Tara Watson. 2024. “New Immigration Estimates Help Make Sense of the Pace of Employment.” Report. The Brookings Institution (March).
Feroli, Michael. 2024. “U.S.: The Economic Effects of Surging Immigration.” JP Morgan, North America Economic Research (March 19).
Walker, Ronnie. 2024. “U.S. Daily: Upgrading Our GDP and Payrolls Forecasts to Reflect Elevated Immigration.” Goldman Sachs, Economics Research (March 17).

Stephanie A. Stewart is a research associate in the Economic Research Department of the Federal Reserve Bank of San Francisco.

Frank Sinatra fans celebrate 109 years since the iconic crooner was born at party in Grasmere dining spot | Inside Out

U.S. Continues To Dominate In World Cup Men’s Freeski Halfpipe

See the latest class of individuals joining the Greater Lansing Sports Hall of Fame

Luminous Pluck: The Story of a World War II Heroine

How Unequal Pay And Unpredictable Earnings Cause Stress For Women In Sports
The best unconventional Christmas movies as shared by Yahoo readers

Jameis Winston inactive, David Njoku active for Browns on Sunday

Apple might be working on a smart doorbell | TechCrunch

Eagles inactives: Sydney Brown will play vs. Commanders
