Sports
MLB trends: Byron Buxton’s resurgence, MacKenzie Gore’s breakout and why you don’t stink at reading fly balls
It feels like Opening Day was just yesterday, but we are beyond the halfway point of the 2024 regular season — 1,279 of 2,430 games have been played, or 53% — and the All-Star break is only two weeks away. The trade deadline is not too far behind that. The samples aren’t small anymore and contenders are starting to separate themselves from pretenders. Well, kind of. There are still a lot of teams in the mushy middle even as we get into July. Here now are three MLB trends worth knowing.
Buxton’s return to center field
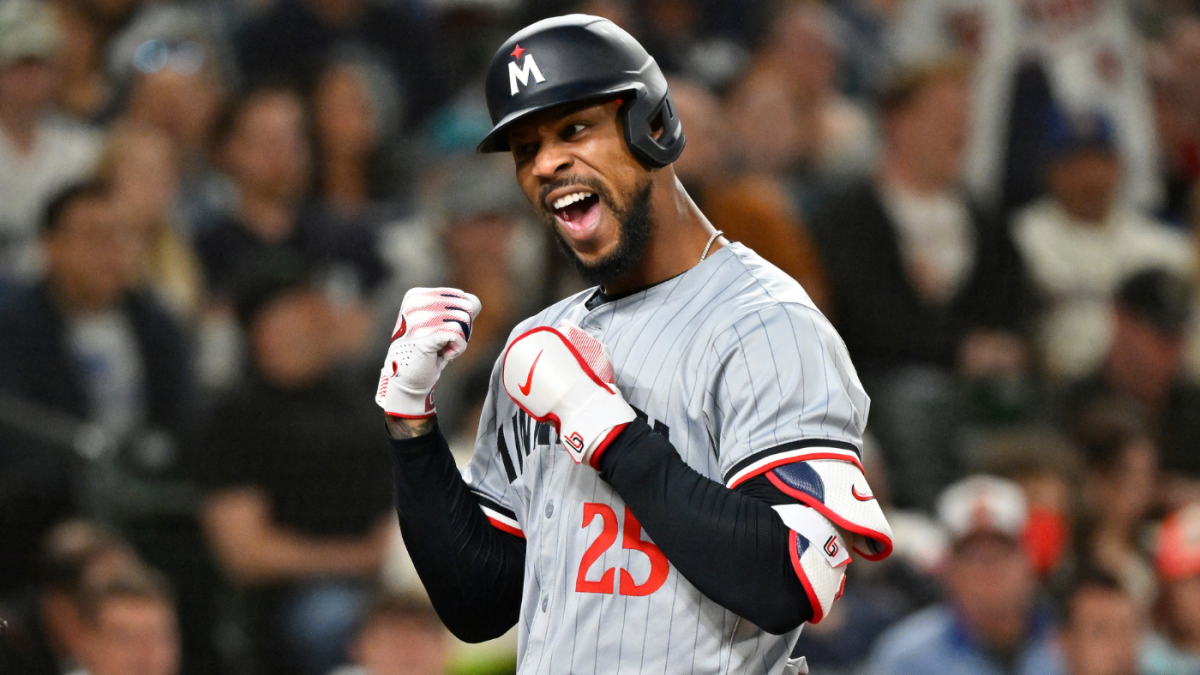
Back in January, Byron Buxton declared himself ready to return to center field after injuries limited him to DH duty in 2023. Buxton is, unfortunately, no stranger to the injured list, with various maladies capping him at just 307 of 708 possible games from 2018-22, or 43%. Last year knee trouble limited Buxton to 85 games even as a full-time DH and he still needed offseason surgery.
Returning to center field full-time seemed ambitious, but other than a 15-day stint on the injured list with knee inflammation in May, it’s gone about as well as the Twins and Buxton could have hoped. He is not playing the same elite center field defense he did in his prime, but he’s playing above-average defense, and he’s running well too. Here are the numbers entering play Tuesday:
|
Innings in CF |
313 1/3 |
509 2/3 |
445 1/3 |
455 2/3 |
|
Defensive runs saved |
+10 |
+11 |
+8 |
+2 |
|
Outs above average |
+4 |
+8 |
+8 |
+3 |
|
Sprint speed |
29.9 ft/s |
29.9 ft/s |
29.1 ft/s |
29.8 ft/s |
|
Home-to-first time |
4.05 sec. |
3.99 sec. |
4.15 sec. |
4.06 sec. |
For reference, the MLB average sprint speed is 27.0 feet per second, and Buxton leads the league in average home-to-first time, fractions of a second ahead of speedsters like Bobby Witt Jr. and Corbin Carroll. Even after multiple knee surgeries, Buxton is running as well as ever. Very, very few in this game can get down the line like he can.
Buxton’s center field defense has slipped from his peak, when he was the best defensive center fielder on the planet. Now he’s “just” an above-average defender, which is still an excellent outcome given the injuries and his age. Buxton turned 30 in December and center field is a young guy’s position. Not many guys play center at 30, let alone play it as well as Buxton.
Buxton’s bat has come around too. He was hitting .250/.300/.391 when he was placed on the injured list on May 3. Since returning on May 18, he’s hitting .268/.316/.512 in 35 games, including .343/.382/.657 in his last 19 games. Injuries are an ongoing concern, but, so far, Buxton’s return to center has been a success. He’s playing good defense, running well, and hitting well lately too.
Gore leveling up
On Monday night, James Wood, one of the best prospects in the game, made his MLB debut with the Nationals. Washington acquired him from the Padres in the Juan Soto trade and the hope is Wood and CJ Abrams, another part of the Soto trade, will join 2023 No. 2 pick Dylan Crews in the lineup when the Nationals once again have a World Series contender.
On the mound Monday was lefty MacKenzie Gore, yet another part of the Soto trade. Once the top pitching prospect in baseball, Gore struggled in 2020 and 2021 before getting his career back on track in 2022. Last season, his first full year in the big leagues, Gore pitched to a 4.42 ERA with 161 strikeouts in 136 1/3 innings. Respectable numbers for a 24-year-old, particularly the whiffs.
This season Gore has elevated his game and improved really in all areas. More strikeouts, fewer walks, less hard contact, etc. Here is where Gore sits this season compared to last year:
|
ERA |
4.42 |
3.47 |
4.08 |
|
K% |
25.9% |
27.2% |
21.8% |
|
BB% |
9.8% |
7.4% |
7.6% |
|
HR/9 |
1.78 |
0.69 |
1.15 |
|
Exit velo |
89.9 mph |
87.4 mph |
89.1 mph |
|
Hard-hit% |
43.7% |
35.5% |
39.4% |
|
FB whiffs |
21.6% |
23.4% |
21.7% |
Forty-seven pitchers threw at least 120 innings last year and at least 80 innings this year, and among those 47, Gore has the seventh-most improved walk rate, the second-most improved average exit velocity, and the second-most improved hard-hit rate. He’s also made pretty big gains with his strikeout rate and, relatedly, his fastball whiff rate.
Gore likely has some home run rate regression coming now that summer is in full swing and it’s nice and hot outside. He’s a fly ball pitcher (only 34.7% grounders in 2024) and eventually a few more fly balls will carry over the fence. That said, you can be a very good pitcher with a homer rate in the 1.10 HR/9 range. Gore is now doing enough (strikeouts, weak contact, etc.) to compensate.
Development is not linear. Sometimes even the very best prospects hit a speed bump and need a little reset before finding their way, and that was Gore a few years ago. Now that he’s in second full MLB season, he’s making real gains and delivering on his prospect pedigree. Gore’s a top tier bat-misser and he’s now pairing it with fewer walks and plenty of weak contact.
Batted ball distances catching up to 2023
It is no secret offense is down this year. Last season teams averaged 4.62 runs per game and 1.23 home runs per nine innings — it was 4.57 R/G and 1.18 HR/9 through June — and this season those numbers are down to 4.37 and 1.08, respectively. We’re not back in the dead ball era of 2014, when teams averaged 4.07 runs per game, but yeah, offense is down in 2024.
Why? That’s difficult to answer. Everyone likes to blame launch angle and the chase for exit velocity, but you kind of have to start with the guys on the mound. They’re so good! Teams are better at coaching up pitchers than ever and their usage is optimized to the nth degree. I’m not sure it’s ever been harder to be a hitter than it is right now.
One thing we do know is the ball is not carrying as far as it did last season. We can check this using “barrels,” which is a fancy term for the best possible contact. They are batted balls hit with a combination of exit velocity and launch angle that produce a .500 batting average and 1.500 slugging percentage. The 2024 barrel rate leaderboard is pretty funny:
- Aaron Judge: 28.9%
- Giancarlo Stanton: 19.4%
- Shohei Ohtani: 19.0%
Judge is on another planet right now. Even then, the MLB average barrel rate is 7.8% — that’s barrels per batted ball, not barrels per plate appearance — and we can see that barrels are not traveling as far this year as they did last year. Here is the average distance for barrels by month, since the weather matters (the balls carries more in the summer, etc.):
|
April |
386.9 ft |
381.9 ft |
385.1 ft |
381.8 ft |
|
May |
386.4 ft |
384.6 ft |
385.8 ft |
383.4 ft |
|
June |
390.4 ft |
387.4 ft |
387.8 ft |
386.8 ft |
In April, barrels were down more than three feet from last April. That gap closed to about two feet in May and then only one foot in June, but even one foot is pretty significant on a league-wise scale. Of course, this year’s monthly barrel data is close to 2022’s, so it could be 2023 that was the outlier. And look at 2021. The ball was flying that year.
Needless to say, the ball itself could be the culprit here, and I don’t mean MLB is deliberately manipulating the baseball. The ball’s specification ranges are pretty wide and they are made by hand, so the manufacturing process can lead to inconsistencies. One batch could be a dead ball, the next batch could be a “juiced” ball (for lack of a better term), so on and so forth.
All you need to know is you’re not going crazy. The ball is not carrying as well as it did last year. I know I’ve seen plenty of balls that looked gone off the bat, only to watch them settle into an outfielder’s glove. We are catching up though. The gap in barrel distance from 2023 to 2024 was smaller in May than it was in April, and even smaller in June than it was in May.

AAA says South Dakota seeing record travel on 4th of July week

Marin’s all-league selections for Spring 2024
‘Can we get on the phone?’: Planet Fitness customer blasts regional manager for how he handled after male staffer ‘violated’ her
Pirates hit 7 home runs, including 2 grand slams, in 14-2 win over Mets

Dog travel laws set to change

Justin Timberlake to open Scottish sports bar after DWI arrest: ‘Will it be called MugShots?’ fans joke
5 takeaways from Biden’s first interview following his disastrous debate performance

‘Sweet as gold’ mother’s body was found wrapped in blanket in shopping cart in Richmond alley
