Jobs
Most Americans Feel Good About Their Job Security but Not Their Pay

Younger and lower-income workers are among the least satisfied with their jobs; majorities say it would be hard to find the kind of job they’d want if they were looking today
Pew Research Center conducted this study to better understand the experiences of American workers.
For most of the analysis in this report, we surveyed 5,273 U.S. adults who are employed part time or full time and who have only one job or have more than one but consider one of them to be their primary job. The survey was conducted Oct. 7-13, 2024.
Everyone who took part is a member of the Center’s American Trends Panel (ATP), a group of people recruited through national, random sampling of residential addresses who have agreed to take surveys regularly. The survey was conducted either online or by telephone with a live interviewer. The survey is weighted to be representative of the U.S. adult population by gender, race, ethnicity, partisan affiliation, education and other factors. Read more about the ATP’s methodology.
This report also includes an analysis of job availability, job characteristics and workforce demographics based of federal government data. Visit the methodology section for more information on these data sources.
Here are the questions used for this report, the topline and the survey methodology.
References to workers include those who are employed part time or full time and who have only one job or have more than one but consider one of them to be their primary job.
References to White, Black and Asian adults include those who are not Hispanic and identify as only one race. Hispanics are of any race.
References to college graduates or people with a college degree comprise those with a bachelor’s degree or more education. “Some college” includes those with an associate degree and those who attended college but did not obtain a degree. “High school” refers to those who have a high school diploma or its equivalent, such as a General Educational Development (GED) certificate.
“Middle income” is defined here as two-thirds to double the median annual family income for panelists on the American Trends Panel. “Lower income” falls below that range; “upper income” falls above it. Read the methodology for more details.
Amid low unemployment nationwide, U.S. workers are feeling good about their level of job security, and relatively few expect to look for a new job in the coming months, according to a new Pew Research Center survey.
At the same time, only half of workers say they are extremely or very satisfied with their job overall. And a much smaller share are highly satisfied with their pay – 30%, down from 34% last year.
The survey, conducted Oct. 7-13 among 5,273 employed U.S. adults, explores how workers see various aspects of their jobs, including how they assess the importance of certain skills and their own opportunities for further training.
Key findings
White and older workers are among the most satisfied with their job overall.
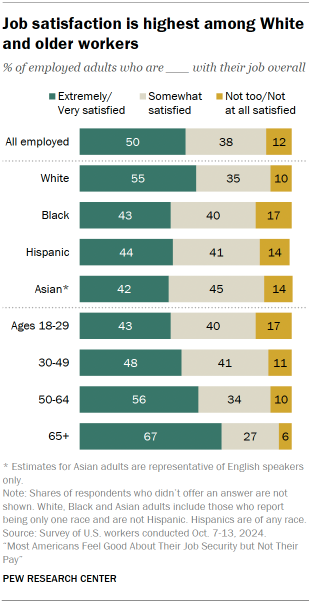
- 55% of White workers say they are extremely or very satisfied, compared with 44% of Hispanic workers, 43% of Black workers and 42% of Asian workers.
- Among workers ages 65 and older, two-thirds say they are highly satisfied with their job. Just 43% of workers ages 18 to 29 say the same.
- Workers with middle and upper family incomes are more likely than those with lower incomes to express high levels of job satisfaction (53% and 54% vs. 42%).
Among the 29% of workers who are not too or not at all satisfied with their pay, the top reason given is that their wages haven’t kept up with increases in cost of living.
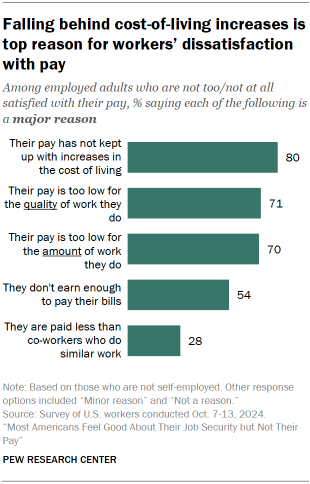
- Large shares also say their pay is too low for the quality (71%) or amount (70%) of work they do.
- 54% say a major reason they are dissatisfied is that they don’t earn enough to pay their bills.
- Lower-income workers who are dissatisfied with their pay are far more likely than those with middle and upper incomes to cite the fact that they don’t earn enough to pay their bills (69% vs. 51% and 30%).
- Large majorities of workers across all family income levels say their pay hasn’t kept up with cost-of-living increases.
Half of workers think of their current job as a career, while 15% say it’s a stepping stone to one. About a third (35%) say it’s just a job to get them by.
- 58% of workers with lower incomes say their job is just something to get them by, compared with 31% of those with middle incomes and 17% of those with higher incomes.
- Workers ages 18 to 29 are less likely than those in older age groups to say they see their job as a career. Still, a majority of young workers say their job is either a career or a stepping stone.
- Half of workers ages 65 and older say their job is just something to get them by, larger than the shares of workers ages 50 to 64 (34%), 30 to 49 (31%) and 18 to 29 (38%) who say the same.
Most workers (69%) feel that they have a great deal or a fair amount of job security.
Another 17% say they have some job security, and 13% say they have little or none.
- 75% of White workers say they have at least a fair amount of job security, compared with smaller majorities of Asian (62%), Black (58%) and Hispanic (57%) workers.
- While about seven-in-ten or more among upper- and middle-income workers say they have a great deal or a fair amount of job security (78% and 71%), a smaller share of lower-income workers (54%) say the same.
Workers are now much more likely than in 2022 to say it would be difficult for them to get the kind of job they’d want if they were to look for a new one.
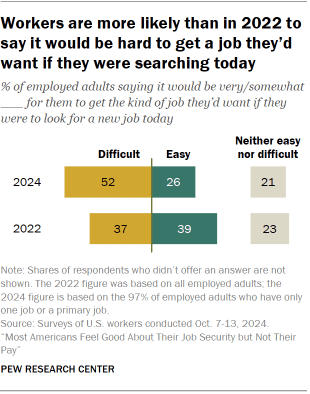
- 52% of workers say this would be difficult, compared with 37% in 2022.
- Workers ages 18 to 29 (58%) and those with lower incomes (62%) are especially likely to say this would be difficult for them.
- As was the case in 2022, most workers (63%) say they’re unlikely to look for a new job in the next six months.
Most workers (70%) say they currently have the education and training they need to get ahead in their job or career, while 30% say they need more education and training.
- Regardless of whether they say they need it, 51% say they have received training in the past 12 months, while a similar share (49%) say they have not.
- Among workers who say they need more education and training, 28% say learning on the job would be the best way for them to get it. About a quarter say completing a certificate program (24%) or getting more formal education (24%) would be the best way.
Among workers who need training but didn’t get any in the last year, many point to time and resource constraints as major reasons for not doing so.
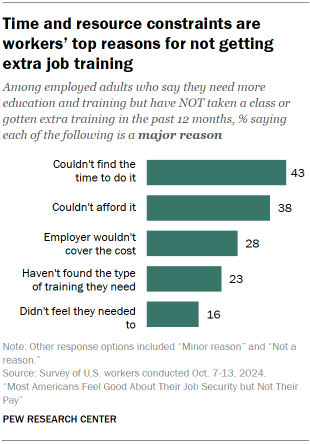
- 43% say they couldn’t find the time, 38% say they couldn’t afford it and 28% say their employer wouldn’t cover the cost.
- 41% of workers with lower incomes and 43% of those with middle incomes who say they need but did not get training say they couldn’t afford it. Only 11% of upper-income workers say the same.
About four-in-ten workers (42%) say most Americans have a great deal or a fair amount of respect for people who do the type of work they do.
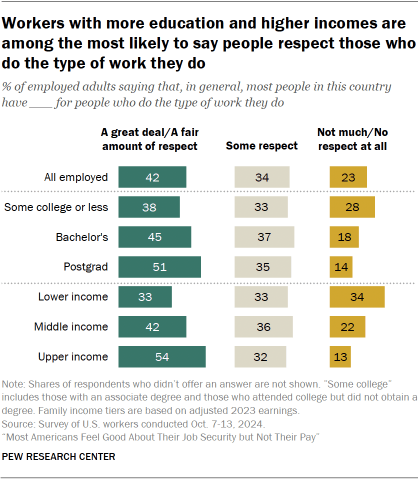
- Workers with less education and lower incomes – and those whose jobs involve manual or physical labor – are among the least likely to say most Americans have a lot of respect for people who do their type of job.
- At the same time, majorities of workers across education and income levels and regardless of the type of work they do say their supervisors, co-workers and clients or customers treat them with respect all or most of the time.
What work looks like today
In addition to the survey findings, the report uses government data to examine labor market changes in recent decades.
Among the key trends:
- In 2023, the unemployment rate was 3.6%, one of the lowest in the past 70 years.
- Job tenure data shows that workers are not job-hopping more than in the past.
- Wages are up compared with 2000 after adjusting for inflation.
- The shares of workers who are Asian, Hispanic, immigrants or have at least a bachelor’s degree have grown significantly since 2000. This reflects broader changes in the U.S. population overall.


