Shopping
Shopping Center REITs Are Hot: Pick A Winner

buzbuzzer
The current environment appears to be very favorable to real estate investment trusts, or REITs, and Shopping Center REITs in particular. REIT prices and yields have normalized, following the sell-off of 2022 and most of 2023, and the expected cuts in the prime rate, with the corresponding drop in treasury yields, will only help REITs further. The average REIT yield of 3.40% is nearly on par with the 10-year treasury yield of 3.85%, so REITs with higher-than-average yield or better-than-average growth prospects stand to do well in the coming months. This was reflected in Q2 earnings season, in which 59% of the REITs that provide FFO guidance raised their outlook, handily exceeding the historical Q2 average of 40 — 45%.
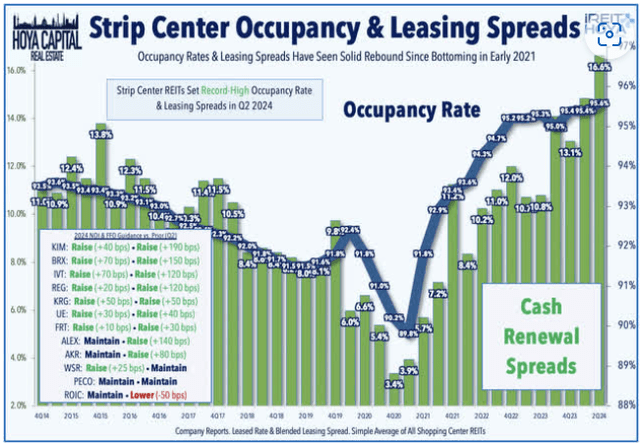
Shopping Center REITs offer both above-average yield and superior growth prospects. The average yield for Shopping Center REITs, according to iREIT+Hoya Capital, stands at 3.88%, and Shopping Center REITs led the way during earnings season. As for Q2 earnings, according to that same source,
record-high occupancy rates resulting from a decade of limited new development fueled another quarter of double-digit rental rate spreads. . . Nine strip center REITs raised their full-year FFO outlook while just one lowered their FFO target as demand for “big box” space has significantly exceeded the available supply despite the several recent high-profile retail bankruptcies. Strip Center REITs reported that blended rent spreads averaged 16.0% in Q2 – the strongest on record – while occupancy rates also set fresh record-highs at 95.6%. . . Small-shop occupancy – which has generally lagged since the pandemic – also improved across the board, with several REITs identifying this as an area of focus and catalyst for growth
In an article I wrote last year in August, I said this about the 2024 outlook for REITs:
What a season it is likely to be! REIT valuations are down and yields are up. According to Hoya Capital Income Builder, the average REIT is selling for just 16.5x FFO, well below its usual 18.0 – 20.0 range, and yielding around 4.00%. With inflation now riding below the average REIT yield, REITs are likely to become relatively more attractive to income investors. With the exception of a few sectors hit especially hard by the pandemic (I’m looking at you, Office and Regional Malls), REIT balance sheets are in very good condition, with an average Debt Ratio of just 30%, and Debt/EBITDA of just 5.8. And historically, REITs do very well once interest rates stabilize, as it appears they have (or soon will).
From April to July, I briefly turned bearish on REITs. This was almost entirely based on technical analysis I got, from a usually reliable source. In early May, I wrote:
I will not be a FROG investor this year. Even though interest rates are still likely to fall . . . it looks like the next couple of years will be rough on REITs. . . . This is a 180-degree about-face from my outlook at the beginning of this year. I base this new expectation primarily on the technicals . . . We will know for sure if the price of VNQ falls below $70.61 before it regains its December 14 high of $90.09.
Well, VNQ price did just the opposite. It rose convincingly past $90.09, sitting at $95.08 as of this writing, and never even dropped below $80. The technical analysis I bought into was just flat wrong. I apologize to my readers for that 3-month fever dream. My bad.
My big-picture expectation now is that VNQ will rise to approximately $129 over the coming year or so, an upside of about 35%. And Shopping Center REITs are poised to continue leading the way.
This article examines liquidity, revenue growth, size, volatility, dividend yield, dividend growth, and pricing considerations for 15 Shopping Center REITs, to single out the one company best poised to deliver outperformance over the next 2 to 5 years.
What the numbers say
My FROG-hunting approach to REIT investing relies on just 7 numbers:
- Liquidity ratio (Assets/Liabilities)
- Growth in Funds From Operations (FFO)
- Growth in Total Cash From Operations (TCFO)
- Growth in Dividends
- Market Cap
- Growth in share price
- Volatility.
Hey, what is a FROG anyway?
FROG stands for Fast Rate of Growth. FROG REITs are significant because they usually outperform the market in total return (Gain + Yield). The criteria for identifying a FROG are as follows:
- Positive price gain over the past 3 years
- Liquidity Ratio >= 1.66 (preferably >=2.00)
- FFO and TCFO Growth rate >= 10% (preferably >=20%)
- Market cap of at least $1.4 billion.
- Modeled Return greater than the return posted by the Vanguard Real Estate ETF (VNQ) over the past 3 years.
Modeled Return is my Rube Goldberg invention that combines price gain, dividend yield, dividend growth rate, and volatility to arrive at one number, for comparison to VNQ.
The opposite of a FROG is a COW (Cash Only Wanted), which is a company notable for its prodigious stream of cash dividends and plodding or mediocre revenue growth.
How do the candidates stack up?
There are 15 Shopping Center REITs I track. The candidates are as follows:
- Kimco Realty (KIM)
- Regency Centers (REG)
- Federal Realty (FRT)
- Brixmor Property (BRX)
- Kite Realty (KRG)
- Phillips Edison (PECO)
- SITE Centers (SITC)
- Urban Edge (UE)
- Acadia Realty (AKR)
- InvenTrust (IVT)
- Retail Opportunity (ROIC)
- Alexander & Baldwin (ALEX)
- Saul Centers (BFS)
- Whitestone (WSR)
- CTO Realty (CTO).
First we screen on Liquidity, FFO growth rate per share, TCFO growth rate, and Market Cap, using the criteria above.
| Ticker | Liquidity | FFO Growth % | TCFO Growth % | Market Cap ($B) |
| KIM | 2.24 | 5.49 | 34.79 | 15.7 |
| REG | 2.28 | 6.60 | 13.00 | 13.7 |
| FRT | 1.63 | 6.77 | 14.54 | 9.6 |
| BRX | 1.49 | 6.77 | 9.96 | 8.2 |
| KRG | 2.01 | 11.15 | 60.24 | 5.7 |
| PECO | 2.14 | 3.24 | 11.31 | 5.0 |
| SITC | 2.36 | 32.17 | 7.95 | 3.0 |
| UE | 1.64 | 6.59 | 12.99 | 2.5 |
| AKR | 2.16 | 4.91 | 14.47 | 2.4 |
| IVT | 2.66 | 7.72 | 11.41 | 2.0 |
| ROIC | 1.81 | 1.64 | 11.42 | 1.9 |
| ALEX | 2.57 | 9.49 | 2.07 | 1.4 |
| BFS | 1.33 | 1.76 | 14.80 | 1.0 |
| WSR | 1.59 | 0.00 | 3.73 | 0.7 |
| CTO | 1.95 | 11.58 | 39.35 | 0.4 |
Source: Seeking Alpha Premium and Hoya Capital.
(In all tables in this article, growth rates are 3-year CAGR, unless otherwise specified).
First, we check for companies with Liquidity Ratio less than 1.66. This eliminates FRT, BRX, UE, BFS, and WSR. This does not mean those companies are not good investments, but we are looking for the crème de la crème, the one company most likely to outperform in the next 2 to 5 years.
Next, we check for FFO growth or TCFO growth less than 10.0%.
Next, we eliminate any company with a market cap under $1.4B. Definitive research by Hoya Capital has established that small-cap REITs are swimming upstream, until they reach $1.4B in market cap. That eliminates CTO. However, this company clears all the other hurdles. CTO is what I call a Tadpole (a possible FROG in the making), and may merit a small allocation, if you don’t mind the risk and volatility that come with a microcap.
Hoya Capital’s research also indicates there is a market cap sweet spot. Companies with market cap between $4B and $10B tend to outperform both smaller REITs and larger REITs.
The only company that clears all the first set of screens is KRG, which sits in the market cap sweet spot at $5.7 billion, with liquidity of 2.01, double-digit FFO growth, and scorching 60% growth in TCFO.
Is KRG a FROG?
Round 2: Modeled Return
We are already down to just two contenders. The last FROG criterion is Modeled Return. Here are the ingredients and the result:
| Ticker | Price Gain | Div. Yield | Div. Growth | Div. Score | Vol. | Modeled Return |
| KRG | 7.65% | 4.01% | 14.10% | 5.96 | 24.3 | 13.62 |
| VNQ | (-4.92)% | 3.73% | 5.30% | 4.53 | 24.5 | (-0.39) |
Source: iREIT+Hoya Capital, Seeking Alpha Premium, MarketWatch.com, and author calculations.
Yes, KRG is a FROG. It meets all the previous criteria, and generates a Modeled Return of 13.62, which blows away the VNQ.
Note: Modeled Return is not an attempt to predict total return for the coming year, but rather a measuring stick to identify companies that will outperform. The wider the margin by which a company’s Modeled Return exceeds that of the VNQ, the better its chances of outperforming in the coming year.
The Dividend Score projects the yield 3 years from now, assuming the dividend growth rate does not change.
May I have the envelope, please?
Well, there is no contest here. Although CTO is intriguing as a Tadpole, the winner is the only FROG in the pond…
Kite Realty Group
As always, however, the opinion that matters most is yours. Because it’s your money.


