Fitness
Vertebrate Limbs Resulted from Design | Evolution News

In two previous articles (here, here), I summarized Stuart Burgess’s new paper (“Universal optimal design in the vertebrate limb pattern and lessons for bioinspired design”) that demonstrates common features of vertebrate limbs are better explained by design than by common ancestry, and I explained how embryological studies further support the design hypothesis. Here, I will detail how the conclusion of design is also bolstered by studies of evolutionary fitness landscapes.
Tutorial on Fitness Landscapes
A common metaphor for visualizing evolution is a fitness landscape (here, here, here), which is a three-dimensional plot of the fitness of an organism as a function of variables associated with different traits such as hair color, the shape and length of bones, and the efficiency of digesting toxins. The number of variables can be very large, so the values of all the variables are projected onto the x and y axes of the graph. These axes could also represent individuals’ genetic sequences. The z-axis corresponds to an individual’s fitness, which is commonly understood as the probability that it will produce offspring (Figure 1).
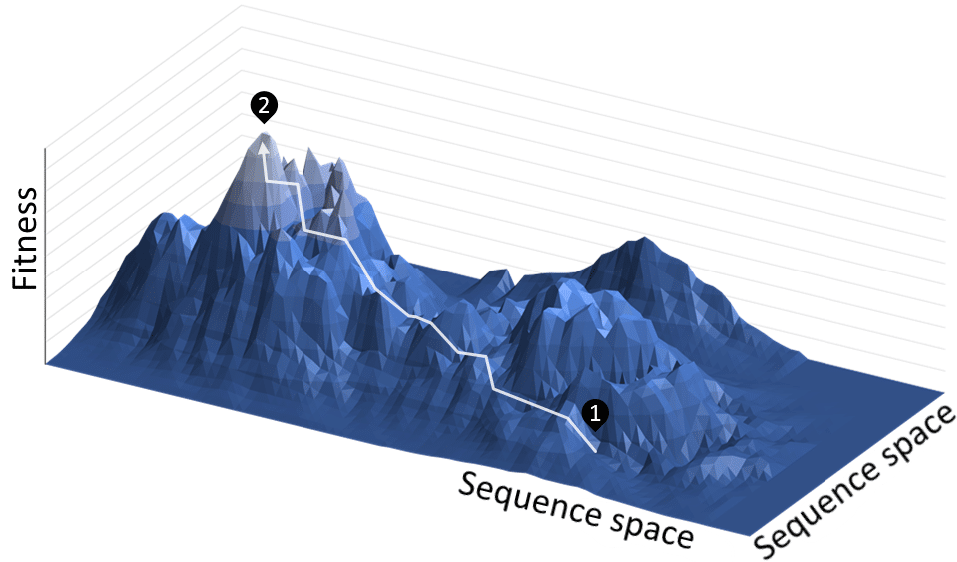
An individual represents a single point on the landscape, a population represents a cluster of points on the landscape, and the genetic variation in the population corresponds to the area or spread of the cluster. The variation can increase through individuals accumulating mutations. The population tends to move uphill since larger z corresponds to individuals producing more offspring (Figure 2).
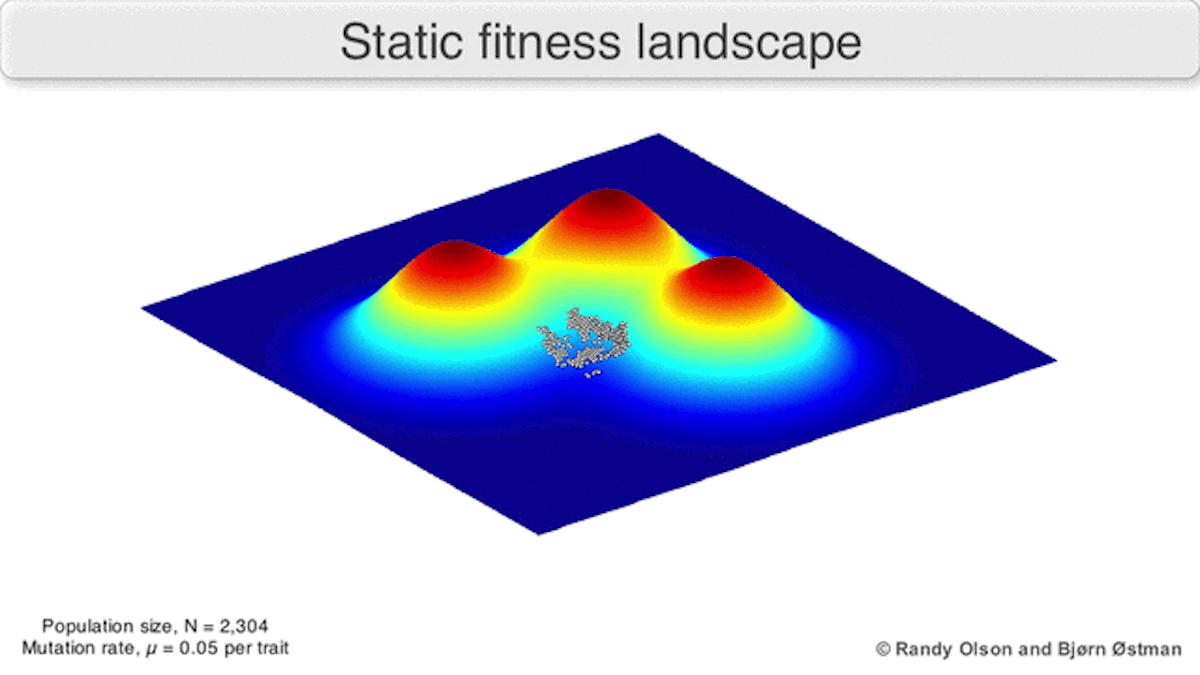
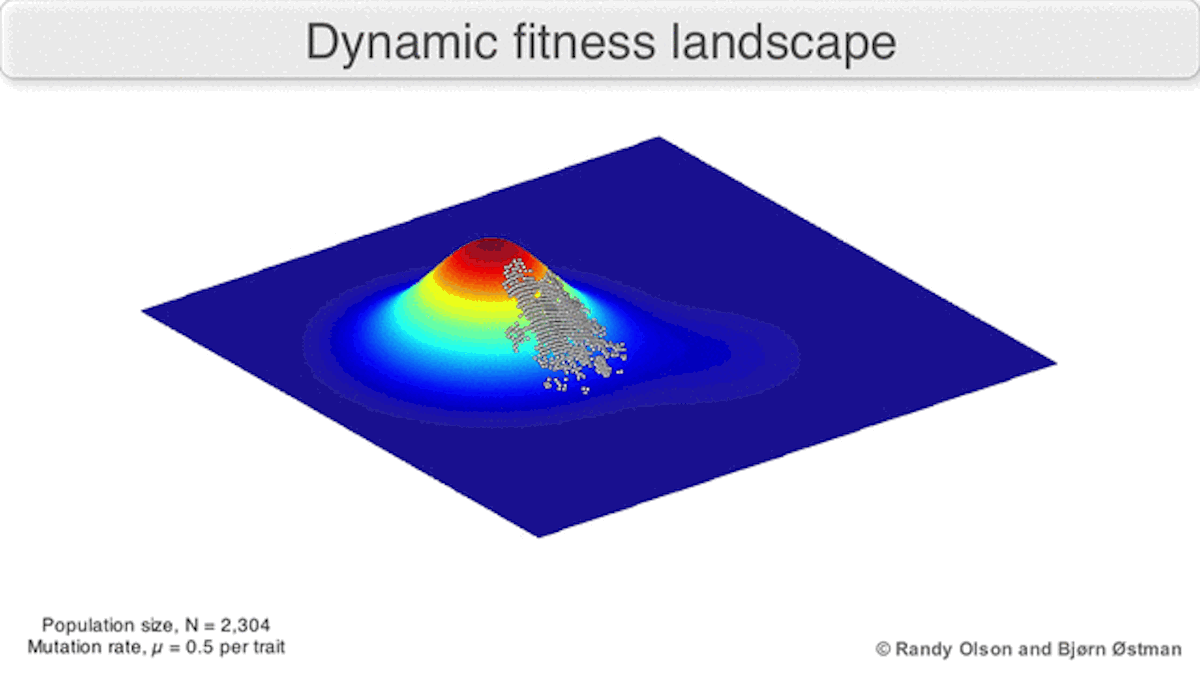
A dynamic landscape will reshape if environmental conditions change, or individual organisms interact with each other in such a way as to alter their reproductive success (Figure 3). In practice, many peaks will remain relatively fixed since they correspond to the operation of traits in any environment an organism might encounter. If a population reaches the top of a static peak, it could remain trapped there for a period or indefinitely.
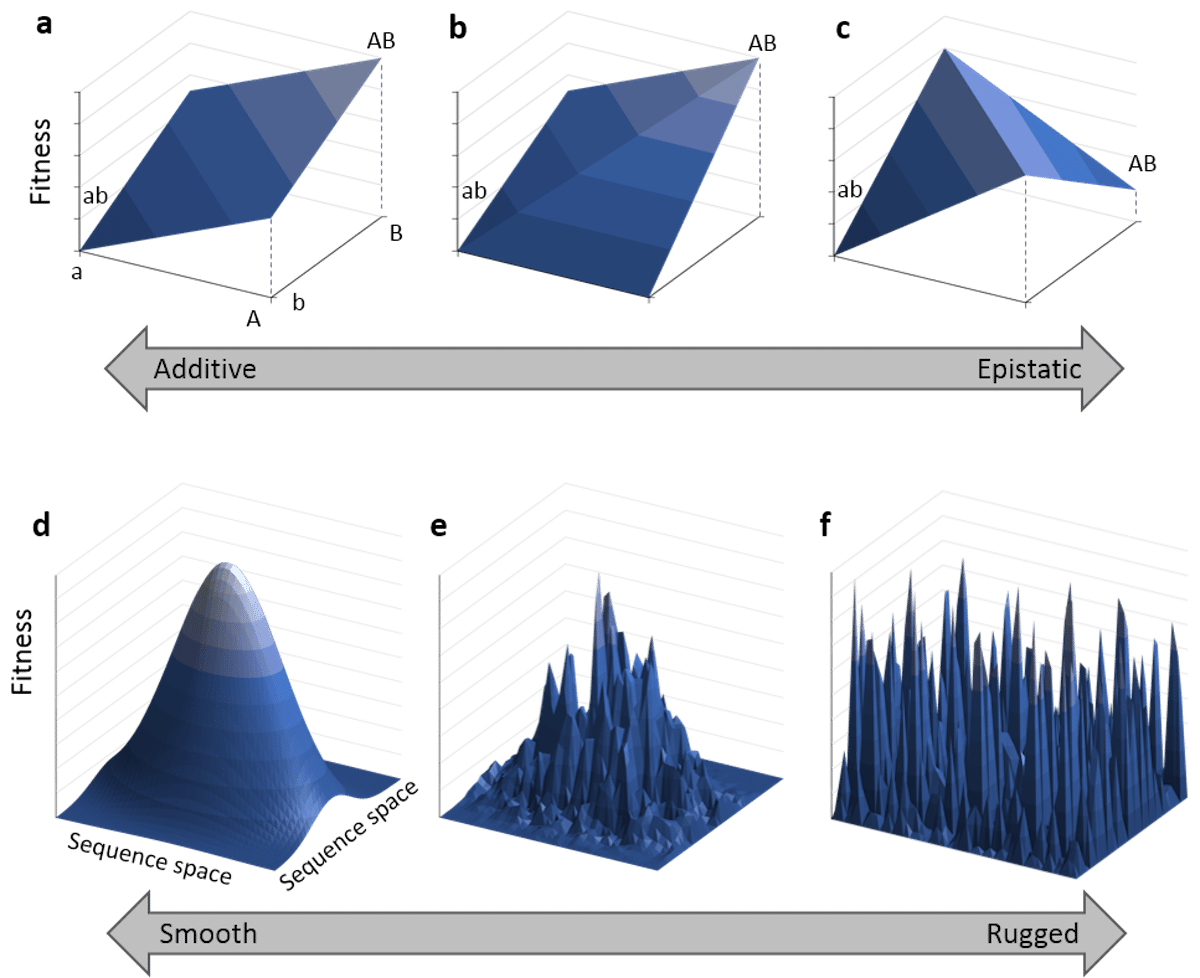
The extent to which a population can traverse a landscape depends on whether the landscape is smooth or rugged. A smooth landscape contains relatively few peaks with gently rising paths connecting the base of one peak to the summit of another (Figures 1 and 4d). An organism could potentially traverse significant distances along such a landscape, resulting in large evolutionary change. In contrast, a rugged landscape contains a multitude of sharp peaks (Figure 4f). Populations will tend to spend most of their time trapped on a local peak, so evolutionary change will be largely confined to minor modifications to existing traits.
The extent to which a landscape is smooth or rugged depends significantly on whether mutations interact additively (Figure 4a) or epistatically (Figure 4c). If they interact additively, the fitness change of two mutations roughly corresponds to the fitness changes of each individual mutation added together. If they interact epistatically, the fitness change from two mutations might be negative (i.e., detrimental) even if the fitness change from each individual mutation is positive (i.e., beneficial). Additive interactions lead to smooth landscapes supporting evolutionary change while epistatic interactions lead to rugged landscapes greatly limiting evolutionary change.
Assessing the Evidence
Empirical studies and theoretical analyses consistently demonstrate that the fitness landscapes associated with complex traits are highly rugged. For instance, paleobiologist Graham J. Slater (2022) in his article “Topographically distinct adaptive landscapes for teeth, skeletons, and size explain the adaptive radiation of Carnivora (Mammalia)” analyzed the landscape for carnivores based on 16 trait variables. He concluded that the fitness landscape is rugged with multiple fitness peaks:
I found evidence of an early partitioning of mandibulo-dental morphological variation in Carnivora (Mammalia) that occurs on an adaptive landscape with multiple peaks, consistent with classic ideas about adaptive radiation.…The dietary adaptive landscape estimated from the first two mandibulodental PC axes by the PhylogeneticEM algorithm contains 21 peaks that are distinct from the ancestral regime.
The ruggedness of landscapes associating with the mechanical design of anatomical structures is further supported by studies on the use of evolutionary algorithms to assist improving robotic designs. Doncieux et al. (2011) observe in their article “Evolutionary Robotics: Exploring New Horizons”:
The difficulty of a problem often arises with the complexity of the fitness landscape: while a smooth, convex fitness landscape with no noise will be quite easy to deal with, most of the problems from the real world often comes with multimodal, noisy fitness landscapes that feature neutrality regions. The direct consequence is that search may often get stalled, would it be at the very beginning of the algorithm execution (i.e. a boostrap problem) or during the course of evolution (i.e. premature convergence), with no hint on how to escape a local optimum or on how to direct the search within a region where all neighboring candidate solutions are equally rewarded. [Emphasis added.]
The ruggedness appears even more extreme for landscapes based on genetic sequences. Visser and Krug (2014) summarize in their paper “Empirical fitness landscapes and the predictability of evolution” how mutational studies demonstrate that fitness landscapes are rugged even for genetic changes confined to small sections of DNA:
At the small genomic scales considered so far, it is observed that sign epistasis is common, which reduces the number of accessible mutational pathways and leads to rugged landscapes with multiple fitness peaks.
Only a limited number of paths are accessible, and those paths require series of mutations that either do not increase the fitness (aka neutral mutations) or reduce it.
The Implications
The technical literature from paleobiology, robotics, and genetics uniformly concludes that fitness landscapes are generally highly rugged even when only a small portion of relevant variables are studied. The ruggedness and constraints on viable paths is only believed by evolutionary theorists to increase with the number of contributing variables and interactions, and the landscape in sequence space for vertebrate limbs represents a set of variables and interactions of enormous size.
These observations present two dire challenges to undirected evolutionary models considering Burgess’s study. First, the vast number of suboptimal local peaks in the fitness landscape precludes any possibility of an evolutionary search ever discovering the perfection of design consistently seen in vertebrates and in other taxa. Second, the constraints on viable paths require a portion of any trajectory along the landscape to include multiple specific neutral and harmful mutations. Yet the timescales required for obtaining coordinated neutral and deleterious mutations is prohibitively long (here, here).
Compounding the challenge, the fitness landscape is only rugged in regions near existing limb designs. The landscape between these regions represent vast seas of nonviable intermediates (here, here, here, here). The only plausible explanation for the perfection of design observed in vertebrate limbs is that a mind engineered them, for only a mind can choose highly optimized solutions out of a sea of possibilities.

‘Mahashmashana’ just might be Father John Misty’s last album : World Cafe Words and Music Podcast

Oregon gains 1,700 jobs, stronger growth than expected

Public fitness equipment maker Interactive Strength shares rise 11% on Bitcoin treasury strategy

Your Free Daily Horoscope for November 22

Fashioning Democracy: Taiwan’s Spirit On The Global Stage
 Q1 2025 Earnings Call Highlights: Revenue Soars …")
Thunderbird Entertainment Group Inc (THBRF) Q1 2025 Earnings Call Highlights: Revenue Soars …
")
The Best Early Black Friday Fashion Sales at Bloomingdale’s, 24S, Nordstrom, Net-A-Porter and More (Updating)

Katy Perry wins appeal in trademark legal case against Sydney fashion label Katie Perry

Unimoni Makes a Resounding Debut at the World Travel Market in London
