World
We’ve improved how search works on Our World in Data

Our new search tools unlock thousands of indicators. Read more about what’s new.
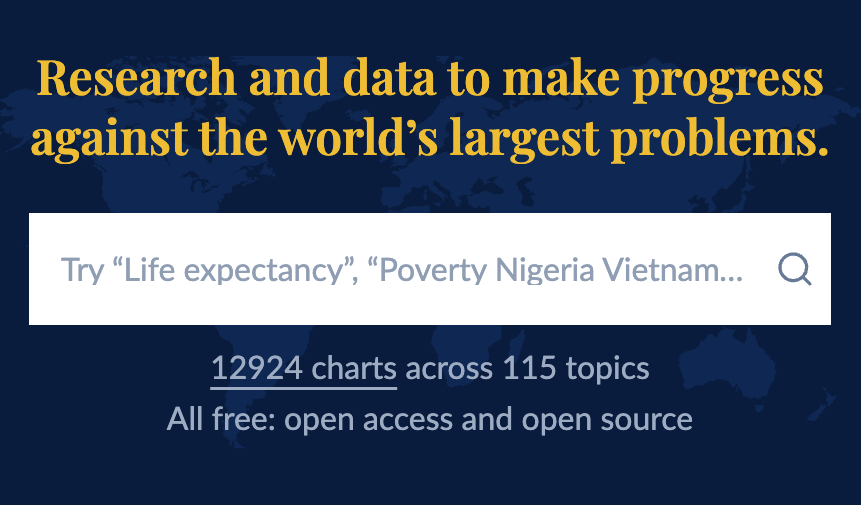
On Our World in Data, you can find thousands of indicators and hundreds of articles covering more than 100 topics on the pressing problems the world faces. This range of content makes the ability to search across our site particularly important.
We recently released some improvements to our search tools that will make it easier for people to explore the range of our work and quickly find what they are looking for.
There are two main changes.
When you include one or more country names in a query, our search now looks for data that includes those countries and shows you an instant preview within our charts.
For example, searching for “Life expectancy Nigeria India Australia” shows you a preview of our top chart results for “Life expectancy” with those countries already displayed.
Clicking “Show more” takes you to the Charts tab, where you can find all relevant chart results.
Clicking on any result takes you to an interactive visualization with those countries selected.
A primary way we make data accessible is through our Data Explorers — interactive visualization tools that allow you to explore a wide range of related indicators.
See, for example, our Data Explorers on:
Each Explorer contains dozens or hundreds of related indicators. Following recent improvements, our search returns relevant results across the thousands of indicators available within our Explorers.
For example, searching for “Coal” now brings up relevant indicators from our CO₂ and Greenhouse Gas Emissions and Energy Data Explorers.
The most relevant Explorer results are shown at the bottom of the main results page.
Clicking “Show more” takes you to the Data Explorer tab of our search results page, where you can find all relevant Explorer results — in this example, further indicators from our Air Pollution, IPCC scenarios, and Fossil Fuels Data Explorers.
Overall, this change to our search functionality means you can now find thousands of new indicators that were not previously accessible through search.
Further improvements to our search functionality are in the pipeline. If you have ideas of what you would like to see when searching on our website or suggestions for any other part of our work, you can leave us feedback by clicking on the “Feedback” button in the bottom right corner of our website.
If you’d like to talk to our product team on a 45-to-60-minute video call about your experience using Our World in Data and how we might improve it, please complete this form.
Reuse this work freely
All visualizations, data, and code produced by Our World in Data are completely open access under the Creative Commons BY license. You have the permission to use, distribute, and reproduce these in any medium, provided the source and authors are credited.
The data produced by third parties and made available by Our World in Data is subject to the license terms from the original third-party authors. We will always indicate the original source of the data in our documentation, so you should always check the license of any such third-party data before use and redistribution.
All of our charts can be embedded in any site.


